Fig. D.1.
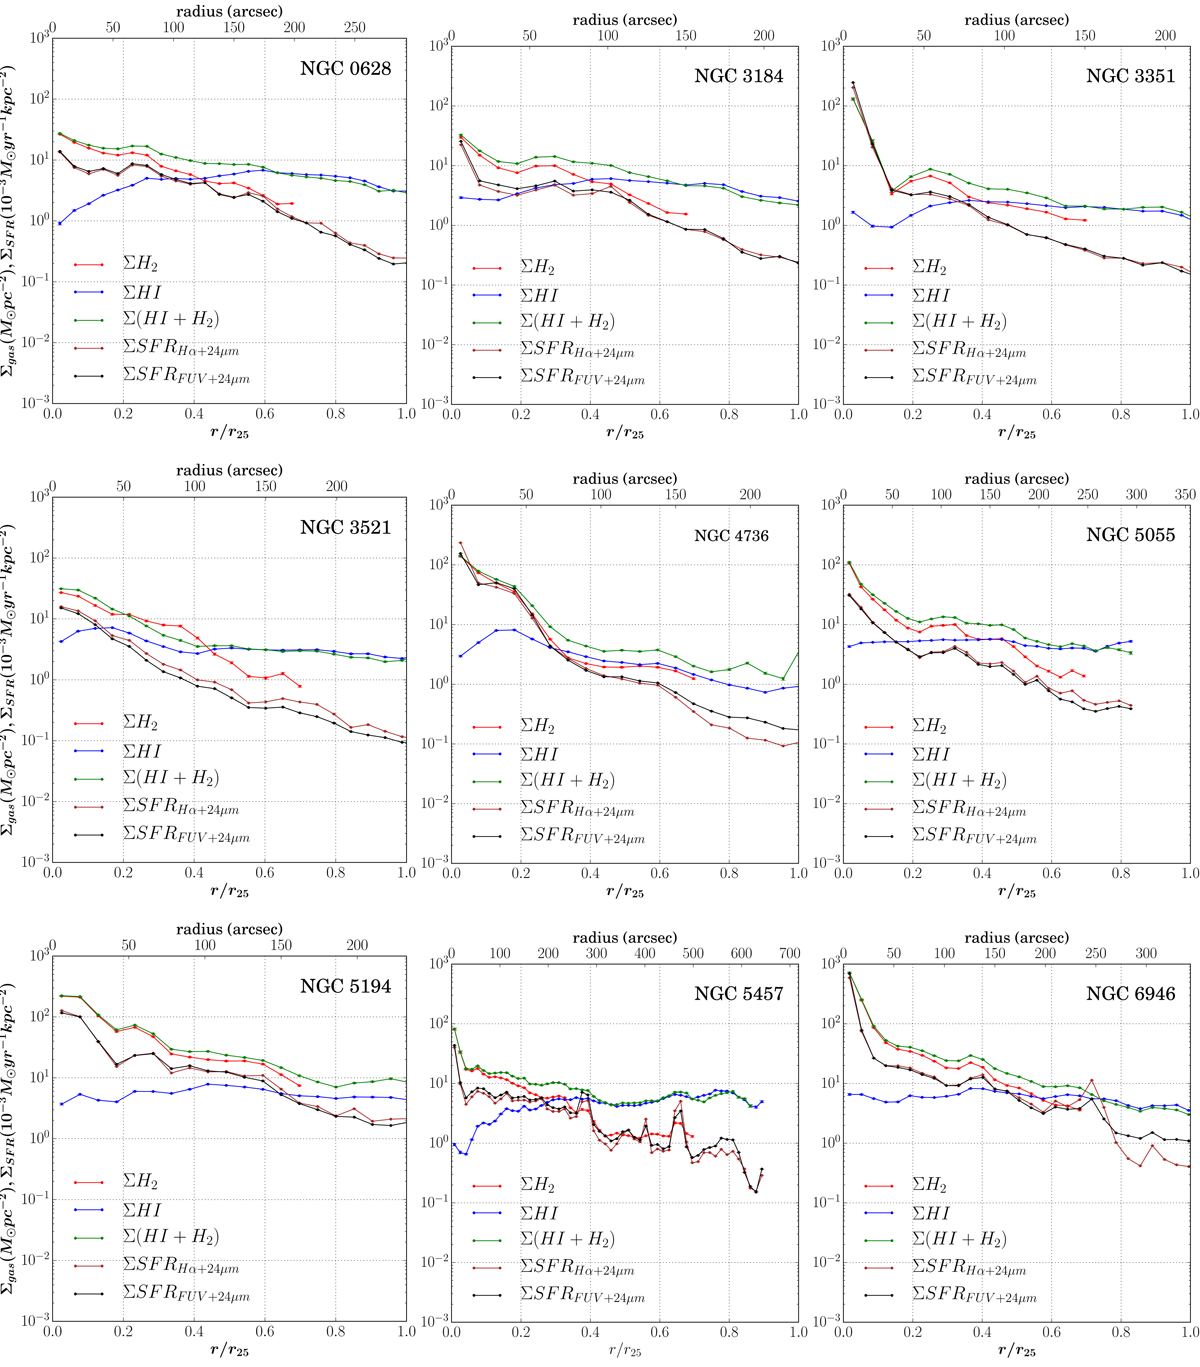
Radial profiles of ΣSFR (original unsubtracted data), ΣH I, ΣH2 and ΣH I+H2 for all nine galaxies in the sample. The x-axis presents the galactocentric radius normalised by r25 (bottom) and in arcsecs (top). The y-axis presents Σgas in units of M⊙ pc−2 and ΣSFR in units of 10−3 M⊙ yr−1 kpc−2 (the scale range is the same for all galaxies). ΣH2 (red curves) and ΣSFR (brown and black curves) show a similar radial falloff for all galaxies. ΣH I (blue curves) have a relatively flat radial profile, usually a deficit towards the centre and show an upper limit of ∼10 M⊙ pc−2.
Current usage metrics show cumulative count of Article Views (full-text article views including HTML views, PDF and ePub downloads, according to the available data) and Abstracts Views on Vision4Press platform.
Data correspond to usage on the plateform after 2015. The current usage metrics is available 48-96 hours after online publication and is updated daily on week days.
Initial download of the metrics may take a while.