Fig. C.2.
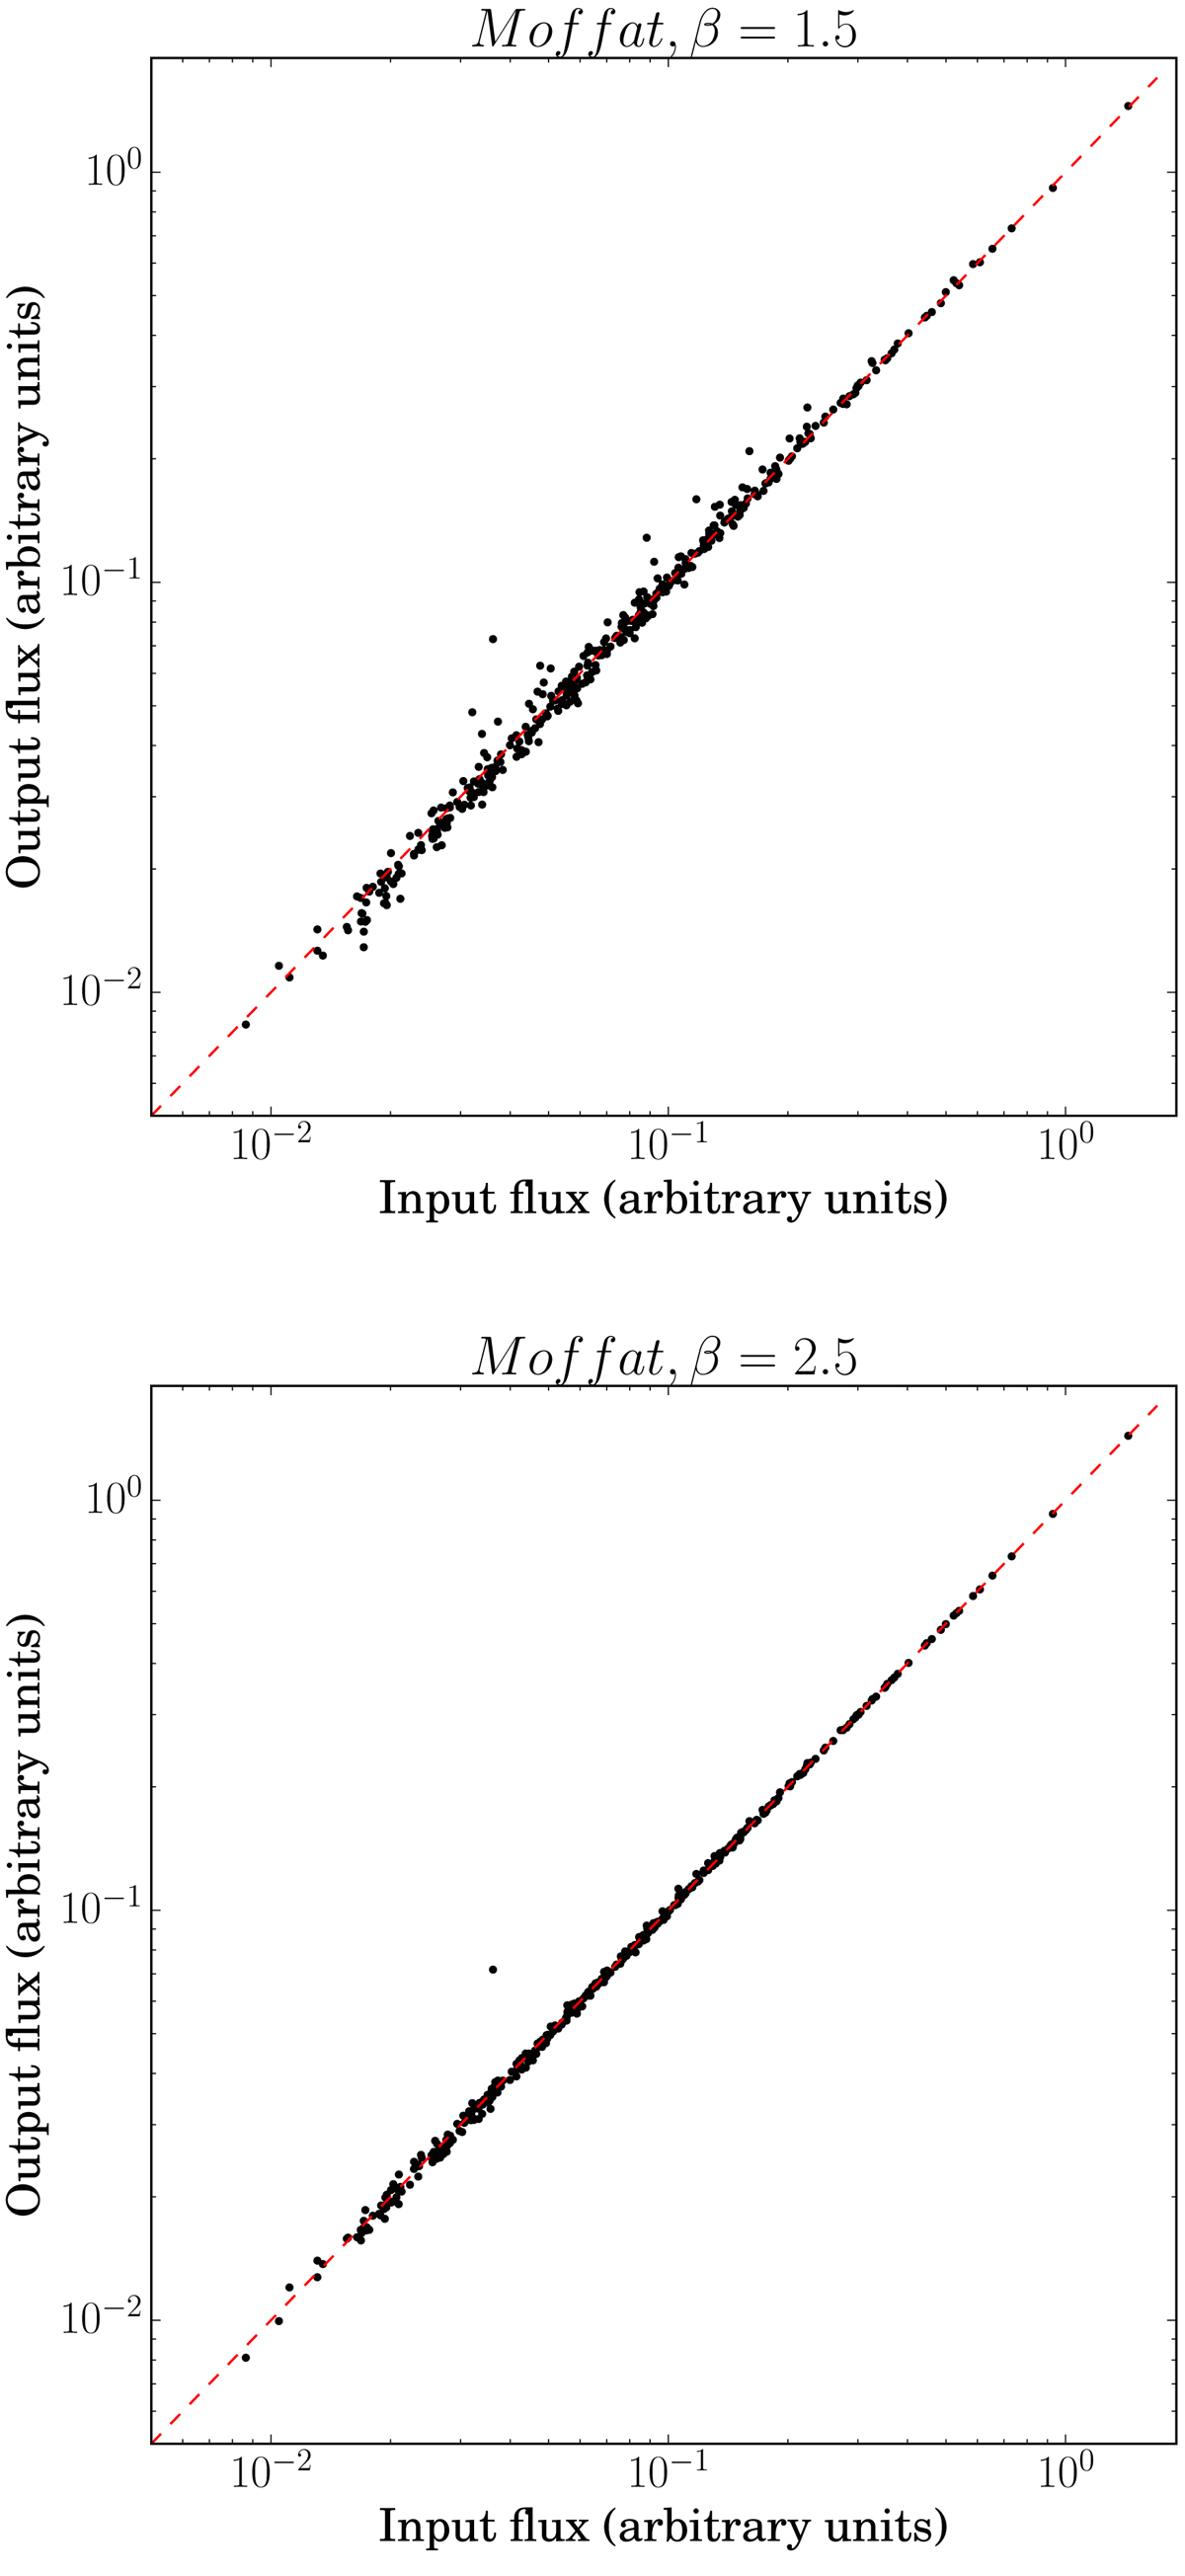
In both panels, x-axis shows the input fluxes to model H II regions in a mock galaxy with an underlying diffuse component and y-axis shows the fluxes in H II regions after diffuse background subtraction. In both panels, the dashed red line is the one-to-one line. H II regions are modelled as the Moffat profiles with β = 1.5 (upper panel) and β = 2.5 (lower panel).
Current usage metrics show cumulative count of Article Views (full-text article views including HTML views, PDF and ePub downloads, according to the available data) and Abstracts Views on Vision4Press platform.
Data correspond to usage on the plateform after 2015. The current usage metrics is available 48-96 hours after online publication and is updated daily on week days.
Initial download of the metrics may take a while.