Fig. 4
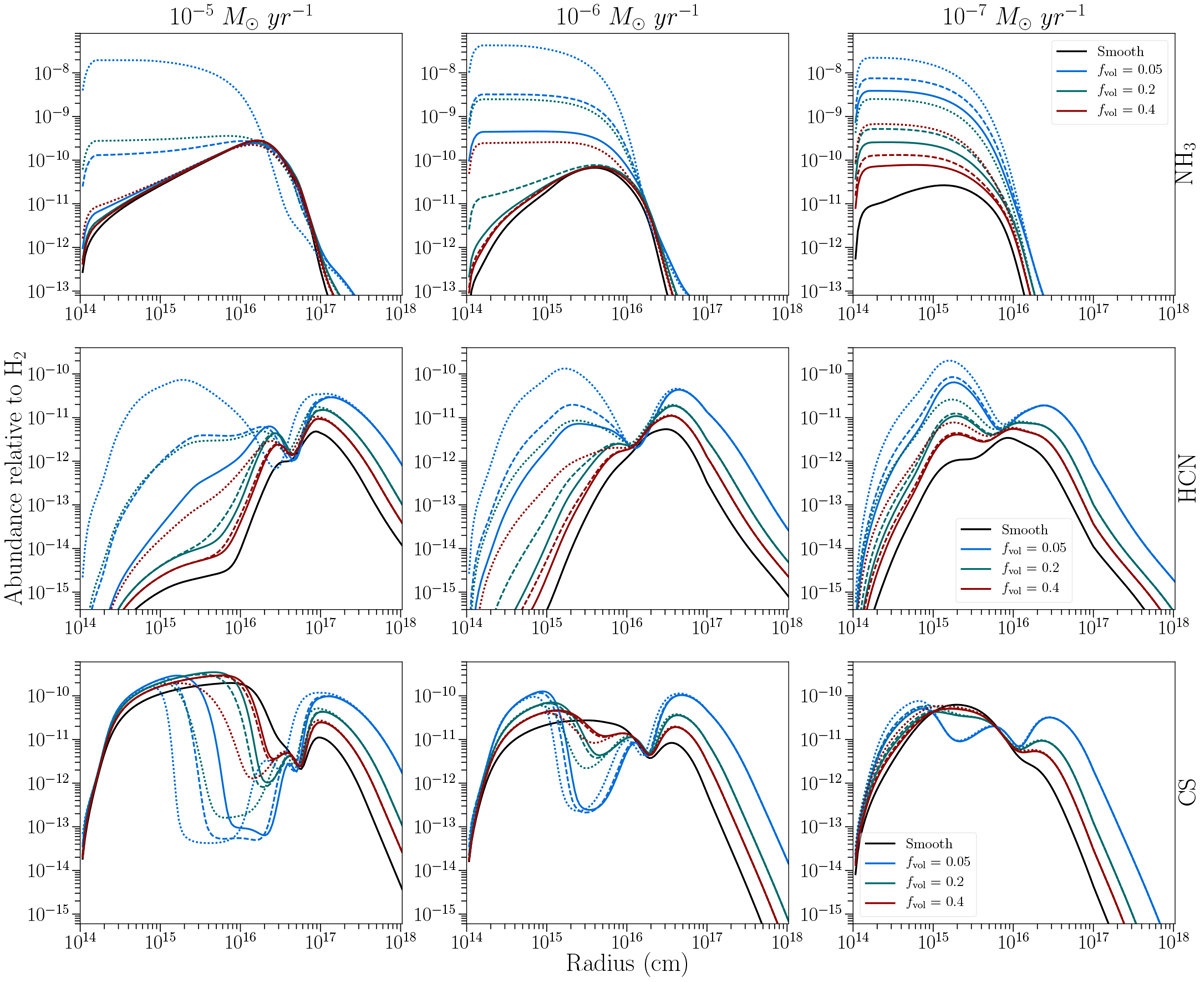
Abundance of NH3 (upper panels), HCN (middle panels), and CS (lower panels) relative to H2 throughout a one-component O-rich outflow with different mass-loss rates Ṁ and clump volume filling factors fvol. Solid black line: calculated abundance for a smooth, uniform outflow. Solid coloured line: characteristic clump scale l* = 5 × 1012 cm, porosity length h* = 1 × 10¹⁴, 2.5 × 10¹³, 1.25 × 1013 cm for fvol = 0.05, 0.2, 0.4, respectively. Dashed coloured line: l* = 1013 cm, h* = 2 × 10¹⁴, 5 × 10¹³, 2.5 × 1013 cm for fvol = 0.05, 0.2, 0.4, respectively. Dotted coloured line: l* = 5 × 1013 cm, h* = 1 × 10¹⁵, 2.5 × 10¹⁴, 1.25 × 1014 cm for fvol = 0.05, 0.2, 0.4, respectively.We note that models with fvol = 0.2, l* = 5 × 1012 cm (green, solid) and fvol = 0.4, l* = 1 × 1013 cm (red, dashed) have the same porosity length h* = 2.5 × 1013 cm. For reference, 1 R* = 5 × 1013 cm.
Current usage metrics show cumulative count of Article Views (full-text article views including HTML views, PDF and ePub downloads, according to the available data) and Abstracts Views on Vision4Press platform.
Data correspond to usage on the plateform after 2015. The current usage metrics is available 48-96 hours after online publication and is updated daily on week days.
Initial download of the metrics may take a while.