Fig. A.4.
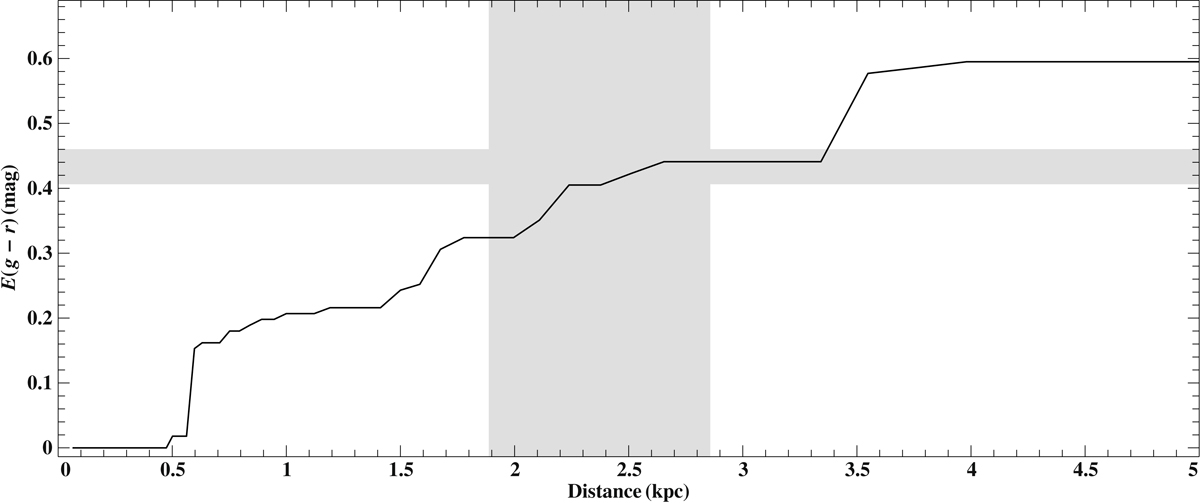
Interstellar reddening vs. distance for the line of sight towards LS V+22 25: The black solid line is the best-fitting sample of the “Bayestar19” dust map (Green et al. 2019; http://argonaut.skymaps.info/). The shaded areas illustrate 1σ uncertainty intervals resulting from the star’s Gaia parallax (ϖ = 0.4403 ± 0.0856 mas; vertical strip) and its measured color excess (the value of E(B − V) from Table A.2 has been converted to E(g − r); horizontal bar).
Current usage metrics show cumulative count of Article Views (full-text article views including HTML views, PDF and ePub downloads, according to the available data) and Abstracts Views on Vision4Press platform.
Data correspond to usage on the plateform after 2015. The current usage metrics is available 48-96 hours after online publication and is updated daily on week days.
Initial download of the metrics may take a while.