Fig. A.3.
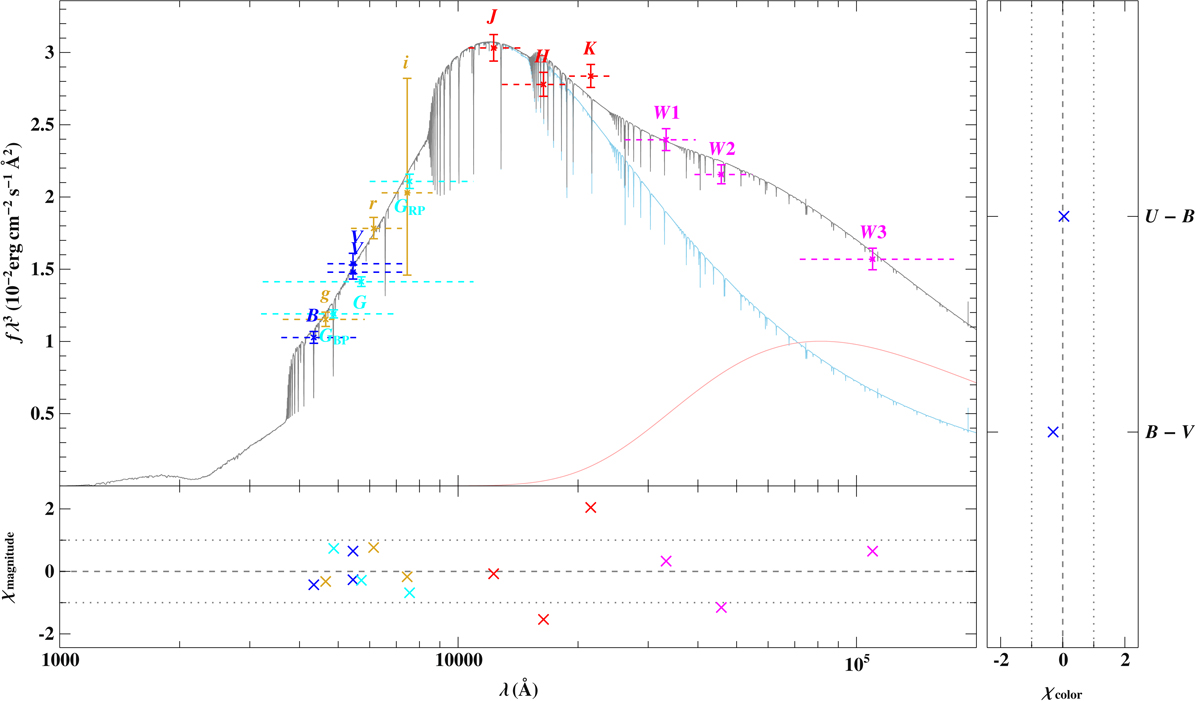
Comparison of synthetic and observed photometry: Top panel: spectral energy distribution. The colored data points are filter-averaged fluxes which were converted from observed magnitudes (the respective filter widths are indicated by the dashed horizontal lines), while the gray solid line represents the best-fitting model, i.e., it is based on the parameters from Table A.2, degraded to a spectral resolution of 6 Å. The individual contributions of the stellar (light blue) and blackbody (light red) component are shown as well. The panels at the bottom and on the side show the residuals χ, i.e., the difference between synthetic and observed data divided by the corresponding uncertainties, for magnitudes and colors, respectively. The photometric systems have the following color code: Johnson-Cousins (blue; Mermilliod 2006; Henden et al. 2015; calibration from Bessell & Murphy 2012); SDSS (golden; Henden et al. 2015); Gaia (cyan; Evans et al. 2018 with corrections and calibrations from Maíz Apellániz & Weiler 2018); 2MASS (red; Skrutskie et al. 2006); WISE (magenta; Cutri et al. 2014).
Current usage metrics show cumulative count of Article Views (full-text article views including HTML views, PDF and ePub downloads, according to the available data) and Abstracts Views on Vision4Press platform.
Data correspond to usage on the plateform after 2015. The current usage metrics is available 48-96 hours after online publication and is updated daily on week days.
Initial download of the metrics may take a while.