Fig. A.2.
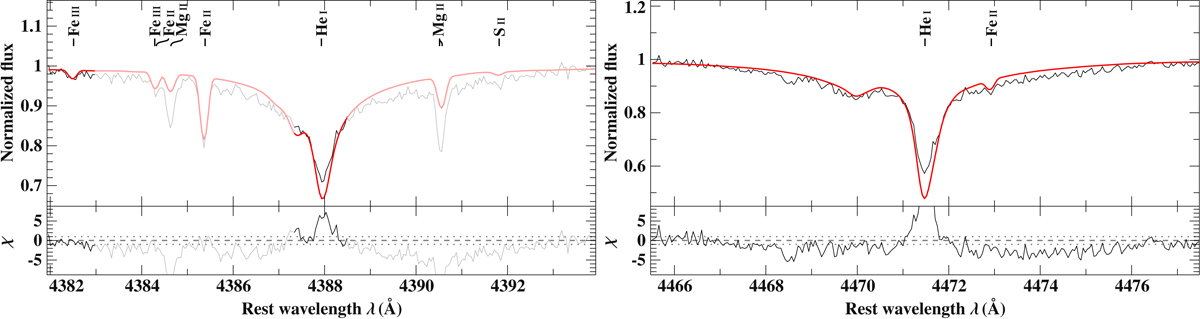
Comparison of best-fitting model spectrum (red line) with re-normalized observation (black line; HIRES spectrum taken on December 24, 2017) with special focus on the broad He I lines 4387.93 Å (left panel) and 4471.48 Å (right panel). Light colors mark regions that have been excluded from fitting. Residuals χ are shown as well. The resulting residual pattern, namely that the observed wings are too strong while the observed cores are too weak, could be indicative of vertical stratification; see, e.g., Schneider et al. (2018) for details, or disk emission filling the line cores.
Current usage metrics show cumulative count of Article Views (full-text article views including HTML views, PDF and ePub downloads, according to the available data) and Abstracts Views on Vision4Press platform.
Data correspond to usage on the plateform after 2015. The current usage metrics is available 48-96 hours after online publication and is updated daily on week days.
Initial download of the metrics may take a while.