Fig. A.1.
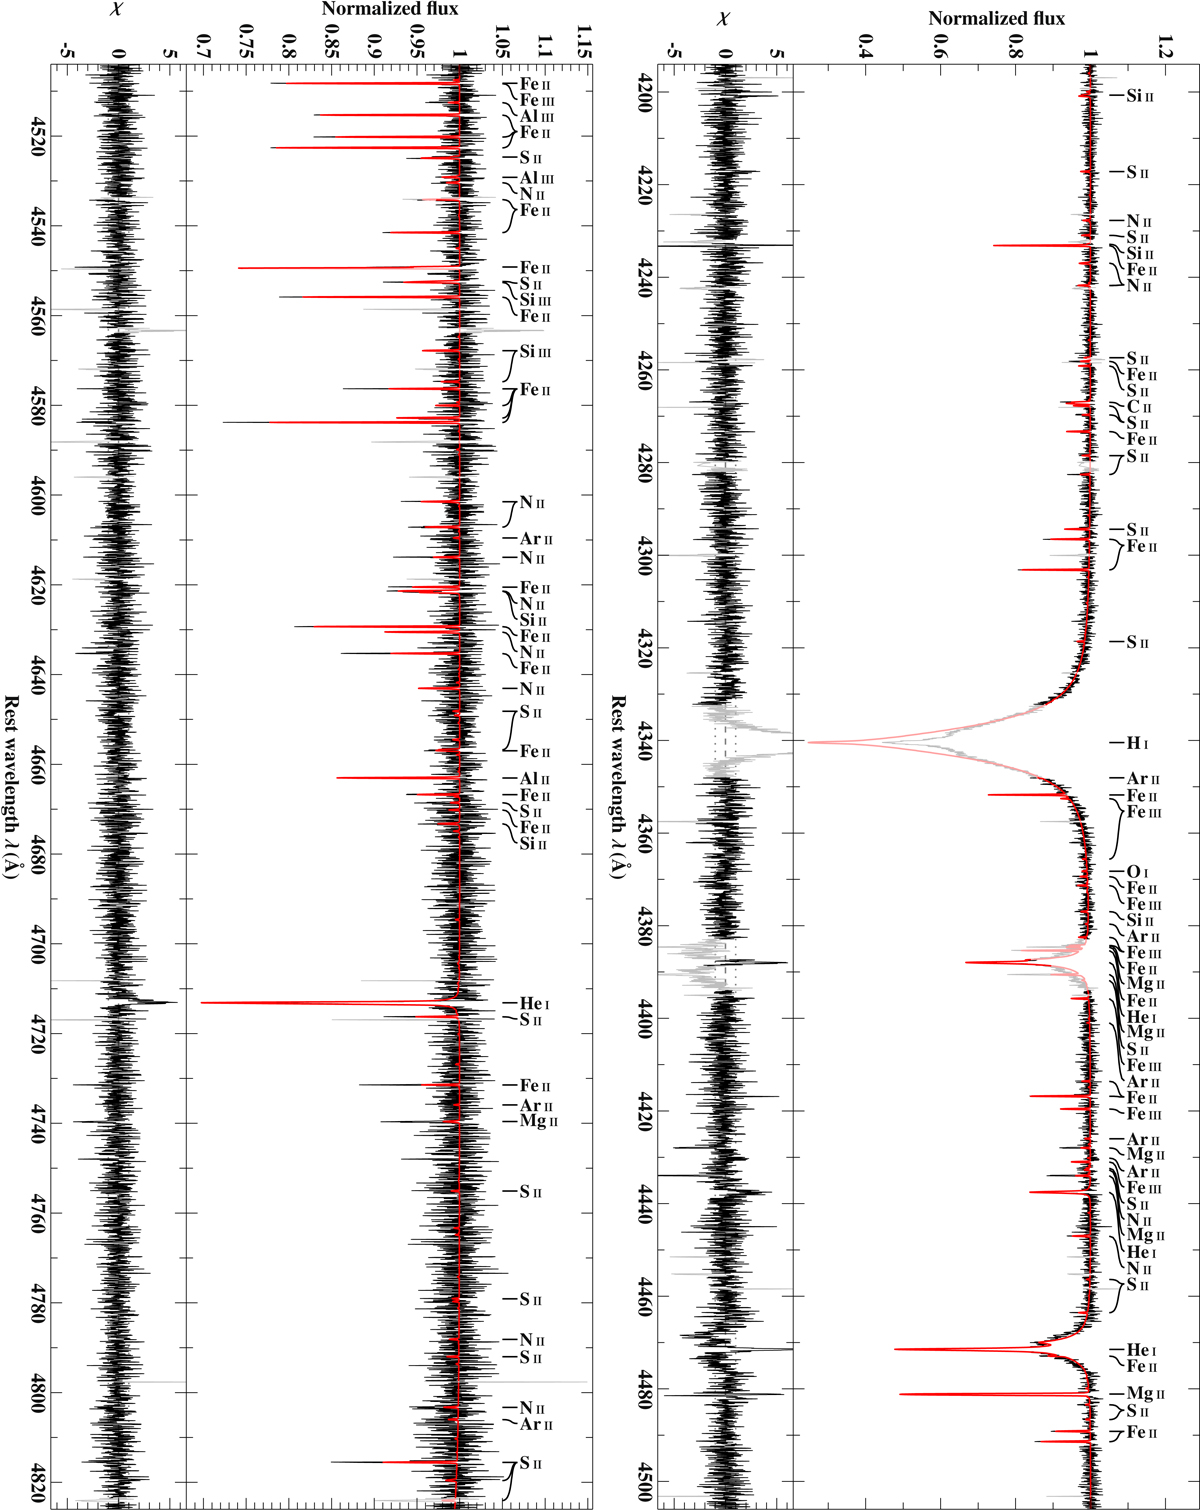
Comparison of best-fitting model spectrum (red line) with re-normalized observation (black line; HIRES spectrum taken on December 12, 2017). Light colors mark regions that have been excluded from fitting, e.g., due to data reduction artifacts or the presence of features that are not properly included in our models such as disk emission in the cores of the hydrogen and helium lines or possible stratification effects in the helium lines. Residuals χ are shown as well.
Current usage metrics show cumulative count of Article Views (full-text article views including HTML views, PDF and ePub downloads, according to the available data) and Abstracts Views on Vision4Press platform.
Data correspond to usage on the plateform after 2015. The current usage metrics is available 48-96 hours after online publication and is updated daily on week days.
Initial download of the metrics may take a while.