| Issue |
A&A
Volume 633, January 2020
|
|
|---|---|---|
| Article Number | L4 | |
| Number of page(s) | 8 | |
| Section | Letters to the Editor | |
| DOI | https://doi.org/10.1051/0004-6361/201937109 | |
| Published online | 10 January 2020 | |
Letter to the Editor
Molecular gas inflows and outflows in ultraluminous infrared galaxies at z ∼ 0.2 and one QSO at z = 6.1⋆
1
Departamento de Astronomía, Universidad de Concepción, Barrio Universitario, Concepción, Chile
e-mail: This email address is being protected from spambots. You need JavaScript enabled to view it.
2
Max-Planck-Institut für Extraterrestrische Physik, Giessenbachstr., 85748 Garching, Germany
3
Department of Astronomy and Joint Space-Science Institute, Univ. of Maryland, College Park, MD 20742, USA
4
Space Telescope Science Institute, Baltimore, MD 21218, USA
5
Institute of Astronomy, University of Cambridge, Madingley Road, Cambridge CB3 0HA, UK
6
Kavli Institute for Cosmology, University of Cambridge, Madingley Road, Cambridge CB3 0HA, UK
7
Departamento de Física y Matemáticas, Univ. de Alcalá, Campus Universitario, 28871 Alcalá de Henares, Madrid, Spain
8
George Mason University, Department of Physics & Astronomy, MS 3F3, 4400 University Drive, Fairfax, VA 22030, USA
9
Raymond and Beverly Sackler School of Physics & Astronomy, Tel Aviv University, Ramat Aviv 69978, Israel
10
Sub-department of Astrophysics, University of Oxford, Keble Road, Oxford OX1 3RH, UK
Received:
14
November
2019
Accepted:
11
December
2019
Abstract
Aims. Our aim is to search for and characterize inflows and outflows of molecular gas in four ultraluminous infrared galaxies (ULIRGs; LIR > 1012L⊙) at z ∼ 0.2−0.3 and one distant quasi-stellar object (QSO) at z = 6.13.
Methods. We used Herschel/PACS and ALMA Band 7 observations of the hydroxyl molecule (OH) line at rest-frame wavelength 119 μm, which in absorption can provide unambiguous evidence of inflows or outflows of molecular gas in nuclear regions of galaxies. Our study contributes to doubling the number of OH 119 μm observations of luminous systems at z ∼ 0.2−0.3, and pushes the search for molecular outflows based on the OH 119 μm transition to z ∼ 6.
Results. We detect OH 119 μm high-velocity absorption wings in three of the four ULIRGs. In two cases, IRAS F20036−1547 and IRAS F13352+6402, the blueshifted absorption profiles indicate the presence of powerful and fast (∼200−500 km s−1) molecular gas outflows. Consistent with an inside-out quenching scenario, these outflows are depleting the central reservoir of star-forming molecular gas at a rate similar to that of intense star formation activity. For the starburst-dominated system IRAS 10091+4704, we detect an inverted P Cygni profile that is unique among ULIRGs and indicates the presence of a fast (∼400 km s−1) inflow of molecular gas at a rate of ∼100 M⊙ yr−1 towards the central region. Finally, we tentatively detect (∼3σ) the OH 119 μm doublet in absorption in the z = 6.13 QSO ULAS J131911+095051. The OH 119 μm feature is blueshifted with a median velocity that suggests the presence of a molecular outflow, although characterized by a modest molecular mass loss rate of ∼200 M⊙ yr−1. This value is comparable to the small mass outflow rates found in the stacking of the [C II] spectra of other z ∼ 6 QSOs and suggests that ejective feedback in this phase of the evolution of ULAS J131911+095051 has subsided.
Key words: galaxies: evolution / galaxies: active / galaxies: high-redshift / quasars: absorption lines
Herschel is an ESA space observatory with science instruments provided by European-led Principal Investigator consortia and with important participation from NASA.
© ESO 2020
1. Introduction
Galaxies form and evolve driven by the complex exchange of regular matter with their surrounding medium in what is commonly known as the baryon cycle. One key element in this process is the flow in and out of galaxies of molecular gas, the fuel for star formation. On the one hand, the accretion of gas is required to sustain the observed star formation rate (SFR) in galaxies across cosmic time (e.g., Tacconi et al. 2010, 2018; Daddi et al. 2010; Bouché et al. 2010; Lagos et al. 2015; Genzel et al. 2015). On the other hand, strong outflows have the potential to remove a large portion of the molecular gas reservoir, which may result in the suppression of the star formation activity (e.g., Feruglio et al. 2010; Cicone et al. 2014; Veilleux et al. 2017; Fiore et al. 2017; Herrera-Camus et al. 2019; Fluetsch et al. 2019).
Finding and characterizing galactic molecular outflows in local and distant galaxies remains a challenge. One recent method that has proved to be successful is to search for P Cygni profiles or high-velocity absorption wings in OH infrared spectra. Herschel, and more recently the Atacama Large Millimeter/submillimeter Array (ALMA), have enabled systematic studies of molecular gas inflows and outflows traced by OH in nearby galaxies and ultraluminous infrared galaxies (ULIRGs; LIR > 1012 L⊙) (e.g., Fischer et al. 2010; Sturm et al. 2011; Spoon et al. 2013; Veilleux et al. 2013; González-Alfonso et al. 2014, 2017; Stone et al. 2016), and high-redshift starbursts (e.g., George et al. 2014; Zhang et al. 2018; Spilker et al. 2018). These studies find powerful molecular outflows with velocities that range from a few hundred to ∼1000 km s−1 and mass loss rates that are comparable or in some cases up to ten times higher than the SFRs.
In this Letter we extend the search for molecular inflows and outflows based on the OH 119 μm doublet into two relatively unexplored and interesting regimes. The first group consists of ULIRGs at z ∼ 0.2−0.3, which are more luminous and at higher redshift than the rest of the Herschel/PACS OH database with the exception of the sample in Calderón et al. (2016). At this redshift we expect these systems to have higher molecular gas fractions than nearby ULIRGs (e.g., Tacconi et al. 2018). The second group contains quasi-stellar objects (QSOs) at z ∼ 6, where we would like to test if large scale molecular outflows play a role in shutting down star formation and black hole growth in the galaxy. Also, OH can prove to be an effective tool to discover molecular outflows in high-redshift QSOs. To date, and with the exception of QSO J1148+5251 (Maiolino et al. 2012; Cicone et al. 2015), there are no molecular outflows detected in individual CO and/or [C II] spectra of z ∼ 6 QSOs (e.g., Wang et al. 2013, 2016; Willott et al. 2015; Shao et al. 2017; Decarli et al. 2017, 2018, 2019).
2. Sample and observations
Our study focusses on five systems. Four of them are ULIRGs at intermediate redshift (0.19 < z < 0.29) selected from The Imperial IRAS-FSC Redshift Catalogue (Wang & Rowan-Robinson 2009), and the fifth is ULAS J131911+095051, a QSO at z = 6.13 (Wang et al. 2013; Shao et al. 2017). The redshifts, infrared luminosities, and classifications of these galaxies are listed in Table 1. As shown in Fig. A.1, these galaxies contribute to doubling the number of galaxies with OH 119 μm observations in the ∼0.2−0.3 redshift range, and push the search for outflows based on OH 119 μm to z ∼ 6. Based on a WISE color-color diagram (Fig. A.1), three of the ULIRGs in our sample have colors consistent with Seyfert/QSO systems, following the criteria by Wright et al. (2010) (see also Mateos et al. 2012; Assef et al. 2013). IRAS F10091+4704, on the other hand, appears to be a starburst-dominated system as suggested by its WISE and mid-infrared colors (Veilleux et al. 2009).
Properties of the galaxies in the sample
Observations of the OH 119 μm doublet for the four ULIRGs were carried out using the PACS instrument (Poglitsch et al. 2010) on board the Herschel Space Observatory (Pilbratt et al. 2010) as part of a Herschel open time program OT2_jgracia_1 (PI, J. Graciá-Carpio). The observation IDs following the order in Table 1 are 1342270673, 1342270662, 1342268181, and 1342270020. The data were reduced using the PACS data reduction and calibration pipeline included in the Herschel Interactive Processing Environment (HIPE; Ott 2010). The spectra used in the analysis were extracted from the central spaxel (9.4″ × 9.4″ in size), and the systemic velocity was set based on the known spectroscopic redshifts listed in Table 1.
The z = 6.13 QSO ULAS J131911+095051 was observed with ALMA Band 7 as part of Project 2012.1.00391.S (PI J. Graciá-Carpio). In order to cover a continuous velocity range of approximately ±2500 km s−1 around the systemic velocity where we expected the OH 119 μm transition (based on z[CII] = 6.1330 ± 0.0007; Wang et al. 2013), we observed the source using two independent observing blocks, and then stitched together pairs of consecutive spectral windows from each block to continuously cover the [348.18,355.60] GHz frequency range. The first and second halves of the frequency range were observed for 41 and 80 min with 32 antennas, reaching sensitivities of 0.19 and 0.14 mJy beam−1 in 150 km s−1 velocity bins, respectively. The half-power beam width (HPBW) in each observing block is approximately the same, HPBW = 0.63″ × 0.44″.
3. Results
3.1. ULIRGs at z ∼ 0.2−0.3
The spectra of the ULIRGs extracted from the Herschel/PACS data are shown in Fig. 1. The vertical lines mark the positions of the 16OH and 18OH doublets and the CH+(3−2) line. The second independent absorption feature detected in IRAS F10091+4704 appears to be associated with the CH+(3−2) transition rather than the 18OH doublet, similar to the case of NGC 4418 (González-Alfonso et al. 2012). Following a procedure similar to that used by Veilleux et al. (2013) and Stone et al. (2016), we use the code PySpecKit (Ginsburg & Mirocha 2011) to fit the 16OH (λ119.233,119.441 μm) doublet using four Gaussian components (two components for each line of the doublet), each characterized by their amplitude, peak position, and standard deviation. From the Gaussian fits we measured v50 and v84 (i.e., the velocities above which 50% and 84% of the absorption takes place). The results are listed in Table 1; also listed are the equivalent widths (EWs), the EW of gas with v < −200 km s−1 (i.e., excluding OH gas at rest), and the flux measured in the OH 119 μm doublet. We estimate an overall error of ±50 km s−1 for the median velocities. We then follow the conservative criteria proposed by Rupke et al. (2005): observed gas flows are inflows if v50 ≳ +50 km s−1, and outflows if v50 ≲ −50 km s−1. According to this convention, IRAS F13352+6402 (v50 = −115 km s−1) and IRAS F20036−1547 (v50 = −70 km s−1) are considered outflows, while IRAS F10091+4704 (v50 = +430 km s−1) is classified as an inflow. IRAS F18216+6419, on the other hand, has no detection of the OH doublets in emission or in absorption. In this case, however, the 1σ uncertainty in the normalized continuum is on the order of 7% in 60 km s−1 channels, about a factor of ∼2 worse than in the other ULIRGs.
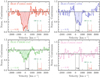 |
Fig. 1. Observed PACS spectra (continuum normalized) of the OH transition at 119 μm of IRAS F13352+6402 (top left), IRAS F10091+4704 (top right), IRAS F20036−1547 (bottom left), and IRAS F18216+6419 (bottom right). The origin of the velocity scale corresponds to the OH 119.23 μm transition at the systemic velocity. The vertical lines mark the positions of the 16OH and 18OH doublets and the CH+(3−2) transition. Two of the systems, IRAS F20036−1547 and IRAS F13352+6402, show evidence of fast (maximum velocity ∼1000 km s−1) molecular outflowing gas, while IRAS F10091+4704 shows evidence of a molecular gas inflow. For QSO IRAS F18216+6419 we do not detect significant levels of absorption or emission in any of the OH features. |
3.2. QSO ULAS J131911+095051 at z = 6.13
Figure 2 shows the ALMA OH spectrum extracted from the inner ∼3 kpc region of ULAS J131911+095051. The rest-frame velocity is set based on a precise redshift measurement derived from the detection of the [C II] line by Wang et al. (2013). We observe a tentative absorption feature blueshifted from the systemic velocity by ∼150 km s−1 that could indicate the presence of a molecular outflow. The significance of the detection, based on the integrated flux inside a single Gaussian fit, is ≈3σ, and the median (v50) and v84 velocities are −154 km s−1 and −314 km s−1, respectively. As Fig. 2 shows, the potential outflow signature in ULAS J131911+095051 resembles in intensity and velocity structure (smoothed to match the ALMA spectrum velocity resolution) the OH 119 μm absorption profile detected in the nearby ULIRG Mrk 273 (Veilleux et al. 2013)1.
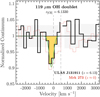 |
Fig. 2. OH 119 μm spectrum of ULAS J131911+095051 (black and yellow). The shaded gray rectangles show the ±1σ uncertainty on the continuum. The systemic velocity is set by the observed redshift of the source based on a secure detection of the [C II] line (Wang et al. 2013). The vertical dashed lines show the expected position for the OH 119 μm doublet. The green line shows the best single-component Gaussian fit to the data. For comparison, we include the Herschel/PACS OH 119 μm spectrum of local ULIRG Mrk 273 (red) smoothed in velocity to match the resolution of the ALMA OH spectrum. |
In Appendix B we discuss the ALMA Band 7 dust continuum properties of the QSO host, including a refined measurement of the far-infrared (FIR) luminosity and the dust mass.
4. Discussion
4.1. Molecular outflows
Figure 3 shows the median velocities and EWs of the OH 119 μm profiles measured in IRAS F13352+6402, IRAS F20036−1547, IRAS F10091+4704, and QSO J131911+095051. We also include measurements of nearby active galactic nuclei (AGNs; Stone et al. 2016), ULIRGs, and QSOs (Veilleux et al. 2013; Spoon et al. 2013), and z ∼ 0.3 hyperluminous infrared galaxies (LIR > 1013L⊙, HyLIRGs; Calderón et al. 2016). The wide spread in OH 119 μm EWs and median velocities at high bolometric luminosities can be partly explained by evolutionary effects, as the covering fraction of the 119 μm continuum by the outflow is expected to vary as systems transition from extremely buried phases with no wide-angle outflows to phases where the outflow activity has subsided (e.g., Veilleux et al. 2013; González-Alfonso et al. 2017; Falstad et al. 2019). These samples show that above a certain luminosity threshold (log10(Lbol/L⊙)≳11.5), galaxies tend to have higher outflow (blueshifted) OH velocities as a function of increasing bolometric luminosity (for a detailed discussion, see Stone et al. 2016). The three ULIRGs in our sample stand out as having large OH 119 μm EWs relative to other systems of similar luminosity. In particular, IRAS F13352+6402 has one of the highest EWs measured to date, only comparable to that measured in Arp 220 (González-Alfonso et al. 2012) or IRAS 20087−0308 (Spoon et al. 2013).
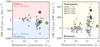 |
Fig. 3. Left: OH 119 μm line median velocities (v50) as a function of bolometric luminosity. Following the criteria by Rupke et al. (2005), we classify gas with median velocity v50 > +50 km s−1 as inflows (top, in red) and gas with v50 < −50 km s−1 as outflows (bottom, in blue). Each galaxy is represented by a symbol: those in our sample are shown as colored circles, and additional samples of nearby AGNs, (U)LIRGs and QSOs, and z ∼ 0.3 HyLIRGs are shown as triangles, diamonds, and squares, respectively. The OH 119 μm line median velocities and bolometric luminosities of these galaxies are drawn from Stone et al. (2016), Veilleux et al. (2013), and Calderón et al. (2016). Right: OH 119 μm equivalent width as a function of bolometric luminosity. The samples of galaxies and the symbols are the same as in the left panel with the addition of the sample of ULIRGs from Spoon et al. (2013) shown as crosses. |
Calculating the mass outflow rate solely based on the often optically thick OH 119 μm doublet profile is extremely challenging. Models that constrain the structure and energetics of the outflow, like the one presented by González-Alfonso et al. (2014, 2017), require the simultaneous detection of multiple OH transitions (e.g., OH 65 μm, 79 μm, 84 μm, and 119 μm) as these are formed at different locations in the wind depending on the excitation conditions of the gas that is radiatively pumped in the outflow. Given that we only have a single OH transition available, we need an alternative method to estimate the mass outflow rate. One possibility is to use an empirical relation between the observed EW of the OH 119 μm absorption component of the profile, the FIR luminosity and the mass outflow rate derived from the model by González-Alfonso et al. (2017) (see Appendix C for details)2. If IRAS F20036−1547 and IRAS F13352+6402 follow the trend observed in nearby ULIRGs shown in Fig. C.1, then following Eq. (C.1) we expect the mass outflow rates to be Ṁout,mol ∼ 290 M⊙ yr−1 and ∼570 M⊙ yr−1, respectively.
IRAS F20036−1547 and IRAS F13352+6402 are both classified as AGNs according to their WISE colors, which implies that the outflows could be driven by a combination of AGN and starburst activity. For IRAS F13352+6402 the AGN contribution to the bolometric luminosity may be as low as ∼10% (Nardini et al. 2010), so if we convert the FIR luminosity associated with the starburst into a SFR we find a mass loading factor η ≳ 1.5. For IRAS F20036−1547 there are no constraints on the AGN contribution to the luminosity, so by assuming that all the FIR emission is associated with the starburst we estimate a mass loading factor lower limit of η ≳ 0.7. These mass loading factors are consistent with outflows driven purely by star formation (e.g., η ∼ 1−3 in NGC 253 or M 82; Bolatto et al. 2013; Leroy et al. 2015) or mixed AGN–starburst activity (e.g., η ∼ 1−3 in IRASF 10565+2448 or Mrk 273; Cicone et al. 2014), so additional information is needed to identify the dominant source behind the wind.
In terms of outflow incidence, if we combine our sample of four ULIRGs at z ∼ 0.2−0.3 with the sample of five HyLIRGs at z ∼ 0.3 from Calderón et al. (2016), we estimate an OH-based outflow detection rate in intermediate redshift ULIRGs of ∼45% (4/9). This fraction is higher than the modest detection rate found among Local Volume Seyferts (∼25%; Stone et al. 2016), but lower than the detection fraction measured in z < 0.2 (U)LIRGs (∼70%; Veilleux et al. 2013).
4.2. Molecular inflows
Molecular gas inflows towards the central region in interacting and/or merging galaxies are expected to periodically replenish the molecular gas that is consumed by star formation or the super massive black hole, and/or ejected by outflows. For IRAS F10091+4704, a merger system where the nuclei have apparently coalesced (Veilleux et al. 2002), we detect a clear inverted P Cygni profile which provides strong evidence of the presence of a molecular gas inflow. This profile is unique among ULIRGs, and is only comparable in significance to the inverted OH 119 μm P Cygni profile observed in Circinus (Stone et al. 2016). As Fig. 3 shows, the inflowing molecular gas in this galaxy has the highest OH median velocity (v50 = +430 km s−1) measured to date. If we use a scaled version the OH-based mass inflow rate measured in NGC 4418 of 12 M⊙ yr−1 (González-Alfonso et al. 2012), we estimate a molecular inflow rate for IRAS F10091+4704 of Ṁmol,in ∼ 12×(211/113)×(3.7×1012/2×1011)1/2 ∼ 100M⊙ yr−1. This inflow rate is about 30% of the total SFR of the system.
In terms of demographics, the inflow in IRAS F10091+4704 is the only one detected in the combined sample of nine intermediate redshift ULIRGs from this work and Calderón et al. (2016). This ∼10% inflow detection rate is similar to that measured in (U)LIRGs by Veilleux et al. (2013) using the OH 119 μm doublet and Rupke et al. (2005) using the Na I D line in absorption. The observed low inflow detection rate has been interpreted as a consequence of the planar or filamentary geometry of inflows that subtend a much smaller covering angle than outflows do. Another explanation could be that fast winds may disturb the molecular gas, preventing it from inflowing to the center. Perhaps the lack of strong AGN activity in IRAS F10091+4704 means that the system is going through a phase of efficient gas replenishment of its nuclear region due to the absence of powerful AGN-driven winds.
4.3. Evidence for a molecular outflow in a z ∼ 6 QSO
With the exception of QSO J1148+5251 (Maiolino et al. 2012; Cicone et al. 2015), there are no other individual QSOs at z ∼ 6 with direct detections of molecular outflows. Part of the problem is that observations of most of these high-z QSOs are not deep enough to detect broad wings of emission in their [C II] or CO spectra (for a discussion, see Bischetti et al. 2019; Stanley et al. 2019). For ULAS J131911+095051, Wang et al. (2013) and Shao et al. (2017) failed to detect any outflow signature in the [C II] spectra. The fact that we tentatively detect the molecular outflow in the OH 119 μm spectra with comparable sensitivity than the [C II] observations makes the OH transitions an interesting alternative to search for outflows in high-z QSOs.
Based on the empirical relation among Ṁout,mol, EW , and LFIR (Appendix C) we determine a molecular mass outflow rate for ULAS J131911+095051 of Ṁout,mol ∼ 200 M⊙ yr−1. This value is only half the star formation rate of the QSO (SFR = 375 M⊙ yr−1 if we assume that only 10% of LFIR is associated with the starburst), which is in stark contrast with the typical molecular mass loading factor of η ∼ 1−10 measured in local (U)LIRGs (e.g., Veilleux et al. 2013; González-Alfonso et al. 2017; Herrera-Camus et al. 2020). The modest mass outflow rate in ULAS J131911+095051 is, however, comparable to the low values found in the stacking analysis of the [C II] spectra of z ∼ 5−7 QSOs by Bischetti et al. (2019) (Ṁout,mol ∼ 100−200M⊙ yr−1) and Stanley et al. (2019).
The kinetic power in the molecular outflow of ULAS J131911+095051, calculated as  , is less than 0.1% of the bolometric luminosity. For an energy-driven wind the expectation is ∼5% if the coupling between the outflow and the ISM is 100% (Faucher-Giguère & Quataert 2012; Costa et al. 2014; Zubovas & Nayakshin 2014). This result, combined with the modest molecular mass outflow rate, suggests that AGN-driven winds have already cleared multiple paths through the nuclear ambient medium of ULAS J131911+095051, reducing the efficiency of the ejective or mechanical mode of negative feedback.
We note, however, that there are some alternatives that could increase the total mass outflow rate in ULAS J131911+095051 and modify this interpretation. For instance, it could be that the molecular gas in the outflow transitions to the atomic phase as it moves farther away from the host (e.g., the case of M 82; Leroy et al. 2015), or that the outflow has a diffuse molecular component that extends beyond the nuclear region and thus can only be detected by other tracers such as CO, [C I], or [C II] line emission. Certainly, deeper and higher angular resolution ALMA observations are required to confirm the existence of the molecular outflow in ULAS J131911+095051 and better characterize its properties.
5. Conclusions
Based on ALMA and Herschel/PACS observations of the OH 119 μm doublet we searched for inflows and outflows of molecular gas in four ULIRGs at z ∼ 0.2−0.3 and one QSO at z ∼ 6. We detect powerful molecular outflows in two ULIRGs (IRAS F20036−1547 and IRAS F13352+6402) with molecular mass outflow rates as high as their SFRs, consistent with expectations from quenching models by way of ejective feedback. We also detect an inverted P Cygni profile in the starburst-dominated system IRAS F10091+4704 which is unique among ULIRGs and suggests a strong inflow of molecular gas (Ṁmol,in ∼ 100 M⊙ yr−1). Finally, we tentatively detect (≈3σ) a molecular outflow in the QSO ULAS J131911+095051 at z = 6.13. The molecular mass outflow rate is modest (Ṁmol,out ∼ 200 M⊙ yr−1), consistent with constraints obtained from stacking of the [C II] line in QSOs at z ∼ 6 (Bischetti et al. 2019; Stanley et al. 2019), and suggest that perhaps we are witnessing a phase in the QSO evolution where mechanical feedback has subsided.
We use Mrk 273 for the comparison as this system has an OH 119 μm absorption feature median velocity (v50 = −201 km s−1) and a continuum-normalized peak absorption intensity (Ipeak/Icont ≈ 0.9) similar to those of the outflow in ULAS J131911+095051.
A similar method is used by Spilker et al. (2018) to estimate the mass outflow rate solely based on the OH 119 μm doublet in a lensed, z = 5.3 submillimeter galaxy. However, Spilker et al. (2018) do not scale the OH 119 μm equivalent width by  .
.
Acknowledgments
We thank the referee for useful comments and suggestions that improved this Letter. R. H.-C. would like to dedicate this Letter to Olivia on her third birthday. E. G. A. is a Research Associate at the Harvard-Smithsonian Center for Astrophysics, and thanks the Spanish Ministerio de Economía y Competitividad for support under project ESP2017-86582-C4-1-R. R. M. acknowledges ERC Advanced Grant 695671 “QUENCH”. This paper makes use of the following ALMA data: ADS/JAO.ALMA#2012.1.00391. S. ALMA is a partnership of ESO (representing its member states), NSF (USA) and NINS (Japan), together with NRC (Canada), MOST and ASIAA (Taiwan), and KASI (Republic of Korea), in cooperation with the Republic of Chile. The Joint ALMA Observatory is operated by ESO, AUI/NRAO and NAOJ. PACS has been developed by a consortium of institutes led by MPE (Germany) and including UVIE (Austria); KU Leuven, CSL, IMEC (Belgium); CEA, LAM (France); MPIA (Germany); INAF-IFSI/OAA/OAP/OAT, LENS, SISSA (Italy); IAC (Spain). This development has been supported by the funding agencies BMVIT (Austria), ESA-PRODEX (Belgium), CEA/CNES (France), DLR (Germany), ASI/INAF (Italy), and CICYT/MCYT (Spain). This research made use of PySpecKit, an open-source spectroscopic toolkit hosted at http://pyspeckit.bitbucket.org
References
- Assef, R. J., Stern, D., Kochanek, C. S., et al. 2013, ApJ, 772, 26 [NASA ADS] [CrossRef] [Google Scholar]
- Bischetti, M., Maiolino, R., Carniani, S., et al. 2019, A&A, 630, A59 [NASA ADS] [CrossRef] [EDP Sciences] [Google Scholar]
- Bolatto, A. D., Wolfire, M., & Leroy, A. K. 2013, ARA&A, 51, 207 [Google Scholar]
- Bouché, N., Dekel, A., Genzel, R., et al. 2010, ApJ, 718, 1001 [NASA ADS] [CrossRef] [Google Scholar]
- Calderón, D., Bauer, F. E., Veilleux, S., et al. 2016, MNRAS, 460, 3052 [NASA ADS] [CrossRef] [Google Scholar]
- Calura, F., Gilli, R., Vignali, C., et al. 2014, MNRAS, 438, 2765 [NASA ADS] [CrossRef] [Google Scholar]
- Cicone, C., Maiolino, R., Sturm, E., et al. 2014, A&A, 562, A21 [NASA ADS] [CrossRef] [EDP Sciences] [Google Scholar]
- Cicone, C., Maiolino, R., Gallerani, S., et al. 2015, A&A, 574, A14 [NASA ADS] [CrossRef] [EDP Sciences] [Google Scholar]
- Costa, T., Sijacki, D., & Haehnelt, M. G. 2014, MNRAS, 444, 2355 [NASA ADS] [CrossRef] [Google Scholar]
- Daddi, E., Elbaz, D., Walter, F., et al. 2010, ApJ, 714, L118 [Google Scholar]
- Decarli, R., Walter, F., Venemans, B. P., et al. 2017, Nature, 545, 457 [NASA ADS] [CrossRef] [Google Scholar]
- Decarli, R., Walter, F., Venemans, B. P., et al. 2018, ApJ, 854, 97 [NASA ADS] [CrossRef] [Google Scholar]
- Decarli, R., Dotti, M., Bañados, E., et al. 2019, ApJ, 880, 157 [NASA ADS] [CrossRef] [Google Scholar]
- Draine, B. T., Dale, D. A., Bendo, G., et al. 2007, ApJ, 663, 866 [NASA ADS] [CrossRef] [Google Scholar]
- Falstad, N., Hallqvist, F., Aalto, S., et al. 2019, A&A, 623, A29 [NASA ADS] [CrossRef] [EDP Sciences] [Google Scholar]
- Faucher-Giguère, C.-A., & Quataert, E. 2012, MNRAS, 425, 605 [NASA ADS] [CrossRef] [Google Scholar]
- Feruglio, C., Maiolino, R., Piconcelli, E., et al. 2010, A&A, 518, L155 [NASA ADS] [CrossRef] [EDP Sciences] [Google Scholar]
- Fiore, F., Feruglio, C., Shankar, F., et al. 2017, A&A, 601, A143 [NASA ADS] [CrossRef] [EDP Sciences] [Google Scholar]
- Fischer, J., Sturm, E., González-Alfonso, E., et al. 2010, A&A, 518, L41 [NASA ADS] [CrossRef] [EDP Sciences] [Google Scholar]
- Fisher, D. B., Bolatto, A. D., Herrera-Camus, R., et al. 2014, Nature, 505, 186 [NASA ADS] [CrossRef] [Google Scholar]
- Fluetsch, A., Maiolino, R., Carniani, S., et al. 2019, MNRAS, 483, 4586 [NASA ADS] [Google Scholar]
- Genzel, R., Tacconi, L. J., Lutz, D., et al. 2015, ApJ, 800, 20 [NASA ADS] [CrossRef] [Google Scholar]
- George, R. D., Ivison, R. J., Smail, I., et al. 2014, MNRAS, 442, 1877 [NASA ADS] [CrossRef] [Google Scholar]
- Ginsburg, A., & Mirocha, J. 2011, Astrophysics Source Code Library [record ascl:1109.001] [Google Scholar]
- González-Alfonso, E., Fischer, J., Graciá-Carpio, J., et al. 2012, A&A, 541, A4 [NASA ADS] [CrossRef] [EDP Sciences] [Google Scholar]
- González-Alfonso, E., Fischer, J., Graciá-Carpio, J., et al. 2014, A&A, 561, A27 [NASA ADS] [CrossRef] [EDP Sciences] [Google Scholar]
- González-Alfonso, E., Fischer, J., Spoon, H. W. W., et al. 2017, ApJ, 836, 11 [NASA ADS] [CrossRef] [Google Scholar]
- Herrera-Camus, R., Fisher, D. B., Bolatto, A. D., et al. 2012, ApJ, 752, 112 [NASA ADS] [CrossRef] [EDP Sciences] [Google Scholar]
- Herrera-Camus, R., Tacconi, L., Genzel, R., et al. 2019, ApJ, 871, 37 [NASA ADS] [CrossRef] [Google Scholar]
- Herrera-Camus, R., Janssen, A., Sturm, E., et al. 2020, A&A, in press, https://doi.org/10.1051/0004-6361/201936434 [Google Scholar]
- Lagos, C. D. P., Crain, R. A., Schaye, J., et al. 2015, MNRAS, 452, 3815 [CrossRef] [Google Scholar]
- Leroy, A. K., Walter, F., Martini, P., et al. 2015, ApJ, 814, 83 [NASA ADS] [CrossRef] [Google Scholar]
- Lutz, D., Sturm, E., Janssen, A., et al. 2020, A&A, in press, https://doi.org/10.1051/0004-6361/201936803 [Google Scholar]
- Maiolino, R., Gallerani, S., Neri, R., et al. 2012, MNRAS, 425, L66 [NASA ADS] [CrossRef] [Google Scholar]
- Mateos, S., Alonso-Herrero, A., Carrera, F. J., et al. 2012, MNRAS, 426, 3271 [NASA ADS] [CrossRef] [Google Scholar]
- Nardini, E., Risaliti, G., Watabe, Y., Salvati, M., & Sani, E. 2010, MNRAS, 405, 2505 [NASA ADS] [Google Scholar]
- Ott, S. 2010, in Astronomical Data Analysis Software and Systems XIX, eds. Y. Mizumoto, K. I. Morita, & M. Ohishi, ASP Conf. Ser., 434, 139 [NASA ADS] [Google Scholar]
- Pilbratt, G. L., Riedinger, J. R., Passvogel, T., et al. 2010, A&A, 518, L1 [CrossRef] [EDP Sciences] [Google Scholar]
- Poglitsch, A., Waelkens, C., Geis, N., et al. 2010, A&A, 518, L2 [NASA ADS] [CrossRef] [EDP Sciences] [Google Scholar]
- Rémy-Ruyer, A., Madden, S. C., Galliano, F., et al. 2014, A&A, 563, A31 [NASA ADS] [CrossRef] [EDP Sciences] [Google Scholar]
- Riechers, D. A., Walter, F., Bertoldi, F., et al. 2009, ApJ, 703, 1338 [NASA ADS] [CrossRef] [Google Scholar]
- Rupke, D. S., Veilleux, S., & Sanders, D. B. 2005, ApJ, 632, 751 [Google Scholar]
- Shao, Y., Wang, R., Jones, G. C., et al. 2017, ApJ, 845, 138 [NASA ADS] [CrossRef] [Google Scholar]
- Spilker, J. S., Aravena, M., Béthermin, M., et al. 2018, Science, 361, 1016 [NASA ADS] [CrossRef] [Google Scholar]
- Spoon, H. W. W., Farrah, D., Lebouteiller, V., et al. 2013, ApJ, 775, 127 [NASA ADS] [CrossRef] [Google Scholar]
- Stanley, F., Jolly, J. B., König, S., & Knudsen, K. K. 2019, A&A, 631, A78 [NASA ADS] [CrossRef] [EDP Sciences] [Google Scholar]
- Stone, M., Veilleux, S., Meléndez, M., et al. 2016, ApJ, 826, 111 [NASA ADS] [CrossRef] [Google Scholar]
- Sturm, E., González-Alfonso, E., Veilleux, S., et al. 2011, ApJ, 733, L16 [NASA ADS] [CrossRef] [Google Scholar]
- Tacconi, L. J., Genzel, R., Neri, R., et al. 2010, Nature, 463, 781 [Google Scholar]
- Tacconi, L. J., Genzel, R., Saintonge, A., et al. 2018, ApJ, 853, 179 [NASA ADS] [CrossRef] [Google Scholar]
- Veilleux, S., Kim, D.-C., & Sanders, D. B. 2002, ApJS, 143, 315 [NASA ADS] [CrossRef] [Google Scholar]
- Veilleux, S., Rupke, D. S. N., Kim, D.-C., et al. 2009, ApJS, 182, 628 [NASA ADS] [CrossRef] [Google Scholar]
- Veilleux, S., Meléndez, M., Sturm, E., et al. 2013, ApJ, 776, 27 [NASA ADS] [CrossRef] [Google Scholar]
- Veilleux, S., Bolatto, A., Tombesi, F., et al. 2017, ApJ, 843, 18 [Google Scholar]
- Wang, L., & Rowan-Robinson, M. 2009, MNRAS, 398, 109 [NASA ADS] [CrossRef] [Google Scholar]
- Wang, L., Farrah, D., Oliver, S. J., et al. 2013, MNRAS, 431, 648 [NASA ADS] [CrossRef] [Google Scholar]
- Wang, R., Wu, X.-B., Neri, R., et al. 2016, ApJ, 830, 53 [NASA ADS] [CrossRef] [Google Scholar]
- Willott, C. J., Bergeron, J., & Omont, A. 2015, ApJ, 801, 123 [NASA ADS] [CrossRef] [Google Scholar]
- Wright, E. L., Eisenhardt, P. R. M., Mainzer, A. K., et al. 2010, AJ, 140, 1868 [NASA ADS] [CrossRef] [Google Scholar]
- Zhang, Z.-Y., Ivison, R. J., George, R. D., et al. 2018, MNRAS, 481, 59 [NASA ADS] [CrossRef] [Google Scholar]
- Zubovas, K., & Nayakshin, S. 2014, MNRAS, 440, 2625 [NASA ADS] [CrossRef] [Google Scholar]
Appendix A: The sample and WISE color-color classification
Figure A.1 shows the redshift and bolometric luminosities of the sample and a WISE color-color diagram used to discriminate between AGNs or starburst-dominated systems following the criteria by Wright et al. (2010), Mateos et al. (2012), and Assef et al. (2013).
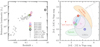 |
Fig. A.1. Left: bolometric luminosity of galaxies with molecular outflows or inflows observed in the OH119 doublet as a function of redshift. The ULIRGs and high-z QSO in our sample are shown as colored circles: IRAS F18216+6419, IRAS F10091+4704, IRAS F13352+6402, IRAS F20036+1547, and ULASJ131911. For comparison of the parameter space covered by our sample, we include HyLIRGs from Calderón et al. (2016), ULIRGs and QSOs from Veilleux et al. (2013) and Spoon et al. (2013), Seyferts from Stone et al. (2016), and one submillimeter galaxy (The Eyelash) at z ∼ 2 from George et al. (2014). Right: WISE color-color diagram of the ULIRGs in our sample. The background illustrates the typical locations of different classes of objects (Wright et al. 2010). The dashed gray box (Mateos et al. 2012) and the red horizontal line (Assef et al. 2013) show different criteria for AGN classification. According to this, three of our systems are classified as AGNs, while IRAS F10091+4704 can be considered a starburst-dominated system. |
Appendix B: ALMA dust continuum map and updated SED
Based on the ALMA Band 7 part of the spectrum that is free from OH features, we construct a dust continuum map of the QSO at a rest-frame wavelength of 125 μm (observed wavelength of 888 μm). As Fig. B.1 shows, dust emission in the QSO is detected with high S/N (≳70) and has a size (FWHM deconvolved from the beam) of 2.5 × 1.5 kpc (0.44″ × 0.25″). We measure a flux density of S125 μm, rest = 8.56 ± 0.12 mJy, which combined with previous dust continuum measurements at rest-frame wavelengths 158 μm (Shao et al. 2017) and 168 μm (Wang et al. 2013) helped us to improve the constraints on the dust mass, dust temperature, and the total infrared luminosity. Figure B.1 (right) shows the observed spectral energy distribution and the best modified blackbody fit. The latter yields a FIR luminosity of log10(LFIR/L⊙) = 13.4 ± 0.16, dust temperature of  K, and a dust mass of log
 . The molecular gas mass based on a CO(6−5) line detection, assuming a CO excitation ladder similar to SDSS J114816.64+525150.3 (Riechers et al. 2009), is Mmol = 1.5 × 10¹⁰ M⊙ (Wang et al. 2013). This results in a dust-to-gas mass ratio of Mdust/Mmol = 0.036.
The dust-to-gas mass ratio in ULAS J131911+095051 is comparable to those values measured in nearby star-forming galaxies (e.g., Draine et al. 2007), other z ∼ 6 QSOs (e.g., Calura et al. 2014), and about two orders of magnitude higher than the dust-to-gas mass ratio measured in local low-metallicity galaxies, often considered as analogs of the dominant population of primeval systems in the early Universe (e.g., Herrera-Camus et al. 2012; Fisher et al. 2014; Rémy-Ruyer et al. 2014).
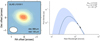 |
Fig. B.1. Left: dust continuum map at observed 888 μm (rest-frame 125 μm) of the QSO ULAS J131911. For a redshift of z = 6.1330 (based on a [CII] 158 μm detection by Wang et al. 2013) this corresponds to a rest-frame wavelength of 124.5 μm. The white contours corresponds to S/N = 5, 10, 20, 40, and 80σ. The synthesized beam (θ = 0.63″ × 0.44″) is shown in the lower left corner. Right: dust continuum SED combining photometric measurements at rest-frame wavelengths 125 μm (our work), 158 μm (Shao et al. 2017), and 168 μm (Wang et al. 2013). The solid blue line corresponds to the best modified blackbody fit to the data. This yields a dust temperature of Tdust = 56.7 K and dust mass of Mdust = 108.73M⊙. The shaded region indicates the 2.5 and 97.5 percentile for the spread of model SEDs based on the posterior distributions for the parameters. |
Appendix C: OH 119 μm equivalent width – mass outflow rate empirical relation
The models of González-Alfonso et al. (2017) are the result of a combination of a core component, which describes the continuum and line absorption produced in the nuclear region of galaxies, and an envelope, which consists of an expanding shell of gas and dust. The molecular mass outflow rate (Ṁmol,out) is proportional to the OH column density and the outflow size, which in turn are proportional to the OH equivalent width (EW119 μm) and the square root of the infrared luminosity ( ), respectively, provided that the outflows remain self-similar with increasing LFIR. To derive an empirical relation that connects Ṁmol,out to the observed EW119 μm and LFIR, we first recalculate the EWs of the galaxies in the study of González-Alfonso et al. (2017) to only consider gas with velocities more blueshifted than −200 km s−1 (i.e., to exclude OH gas at rest) (see also, e.g., Spoon et al. 2013). We refer to this quantity as EW
 . Figure C.1 shows the relation between Ṁmol,out (inferred from the models of González-Alfonso et al. 2017) and the EW
 scaled by
  . The best linear fit, forced to have zero intercept, yields
![Mathematical equation: $$ \begin{aligned} \dot{M}_{\rm mol,out} (M_{\odot }\,\mathrm{yr}^{-1})=0.29\times \Bigg [\frac{\mathrm{EW}^{{ v}<-200\,\mathrm{km\,s^{-1}}}_{\mathrm{OH}\,119\,\mathrm{\mu m}}}{\mathrm{km\,s^{-1}}}\times \Bigg (\frac{L_{\rm FIR}}{10^{10}\,L_{\odot }}\Bigg )^{1/2}\Bigg ], \end{aligned} $$](/articles/aa/full_html/2020/01/aa37109-19/aa37109-19-eq11.gif) (C.1)
(C.1)
and is shown as a black line in Fig. C.1. On top of the best-fit line we show the implied molecular mass outflow rate for IRAS F13352+6402, IRAS F20036−1547, and QSO J131911+095051.
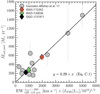 |
Fig. C.1. Total molecular mass loss rates inferred from models of multiple OH transitions in 12 local ULIRGs by González-Alfonso et al. (2017, gray circles) as a function of the observed OH 119 μm equivalent width for gas with velocities v < −200 km s−1 (EW |

All Tables
All Figures
|
Fig. 1. Observed PACS spectra (continuum normalized) of the OH transition at 119 μm of IRAS F13352+6402 (top left), IRAS F10091+4704 (top right), IRAS F20036−1547 (bottom left), and IRAS F18216+6419 (bottom right). The origin of the velocity scale corresponds to the OH 119.23 μm transition at the systemic velocity. The vertical lines mark the positions of the 16OH and 18OH doublets and the CH+(3−2) transition. Two of the systems, IRAS F20036−1547 and IRAS F13352+6402, show evidence of fast (maximum velocity ∼1000 km s−1) molecular outflowing gas, while IRAS F10091+4704 shows evidence of a molecular gas inflow. For QSO IRAS F18216+6419 we do not detect significant levels of absorption or emission in any of the OH features. |
| In the text | |
|
Fig. 2. OH 119 μm spectrum of ULAS J131911+095051 (black and yellow). The shaded gray rectangles show the ±1σ uncertainty on the continuum. The systemic velocity is set by the observed redshift of the source based on a secure detection of the [C II] line (Wang et al. 2013). The vertical dashed lines show the expected position for the OH 119 μm doublet. The green line shows the best single-component Gaussian fit to the data. For comparison, we include the Herschel/PACS OH 119 μm spectrum of local ULIRG Mrk 273 (red) smoothed in velocity to match the resolution of the ALMA OH spectrum. |
| In the text | |
|
Fig. 3. Left: OH 119 μm line median velocities (v50) as a function of bolometric luminosity. Following the criteria by Rupke et al. (2005), we classify gas with median velocity v50 > +50 km s−1 as inflows (top, in red) and gas with v50 < −50 km s−1 as outflows (bottom, in blue). Each galaxy is represented by a symbol: those in our sample are shown as colored circles, and additional samples of nearby AGNs, (U)LIRGs and QSOs, and z ∼ 0.3 HyLIRGs are shown as triangles, diamonds, and squares, respectively. The OH 119 μm line median velocities and bolometric luminosities of these galaxies are drawn from Stone et al. (2016), Veilleux et al. (2013), and Calderón et al. (2016). Right: OH 119 μm equivalent width as a function of bolometric luminosity. The samples of galaxies and the symbols are the same as in the left panel with the addition of the sample of ULIRGs from Spoon et al. (2013) shown as crosses. |
| In the text | |
|
Fig. A.1. Left: bolometric luminosity of galaxies with molecular outflows or inflows observed in the OH119 doublet as a function of redshift. The ULIRGs and high-z QSO in our sample are shown as colored circles: IRAS F18216+6419, IRAS F10091+4704, IRAS F13352+6402, IRAS F20036+1547, and ULASJ131911. For comparison of the parameter space covered by our sample, we include HyLIRGs from Calderón et al. (2016), ULIRGs and QSOs from Veilleux et al. (2013) and Spoon et al. (2013), Seyferts from Stone et al. (2016), and one submillimeter galaxy (The Eyelash) at z ∼ 2 from George et al. (2014). Right: WISE color-color diagram of the ULIRGs in our sample. The background illustrates the typical locations of different classes of objects (Wright et al. 2010). The dashed gray box (Mateos et al. 2012) and the red horizontal line (Assef et al. 2013) show different criteria for AGN classification. According to this, three of our systems are classified as AGNs, while IRAS F10091+4704 can be considered a starburst-dominated system. |
| In the text | |
|
Fig. B.1. Left: dust continuum map at observed 888 μm (rest-frame 125 μm) of the QSO ULAS J131911. For a redshift of z = 6.1330 (based on a [CII] 158 μm detection by Wang et al. 2013) this corresponds to a rest-frame wavelength of 124.5 μm. The white contours corresponds to S/N = 5, 10, 20, 40, and 80σ. The synthesized beam (θ = 0.63″ × 0.44″) is shown in the lower left corner. Right: dust continuum SED combining photometric measurements at rest-frame wavelengths 125 μm (our work), 158 μm (Shao et al. 2017), and 168 μm (Wang et al. 2013). The solid blue line corresponds to the best modified blackbody fit to the data. This yields a dust temperature of Tdust = 56.7 K and dust mass of Mdust = 108.73M⊙. The shaded region indicates the 2.5 and 97.5 percentile for the spread of model SEDs based on the posterior distributions for the parameters. |
| In the text | |
|
Fig. C.1. Total molecular mass loss rates inferred from models of multiple OH transitions in 12 local ULIRGs by González-Alfonso et al. (2017, gray circles) as a function of the observed OH 119 μm equivalent width for gas with velocities v < −200 km s−1 (EW |
| In the text | |
Current usage metrics show cumulative count of Article Views (full-text article views including HTML views, PDF and ePub downloads, according to the available data) and Abstracts Views on Vision4Press platform.
Data correspond to usage on the plateform after 2015. The current usage metrics is available 48-96 hours after online publication and is updated daily on week days.
Initial download of the metrics may take a while.