Fig. 3.
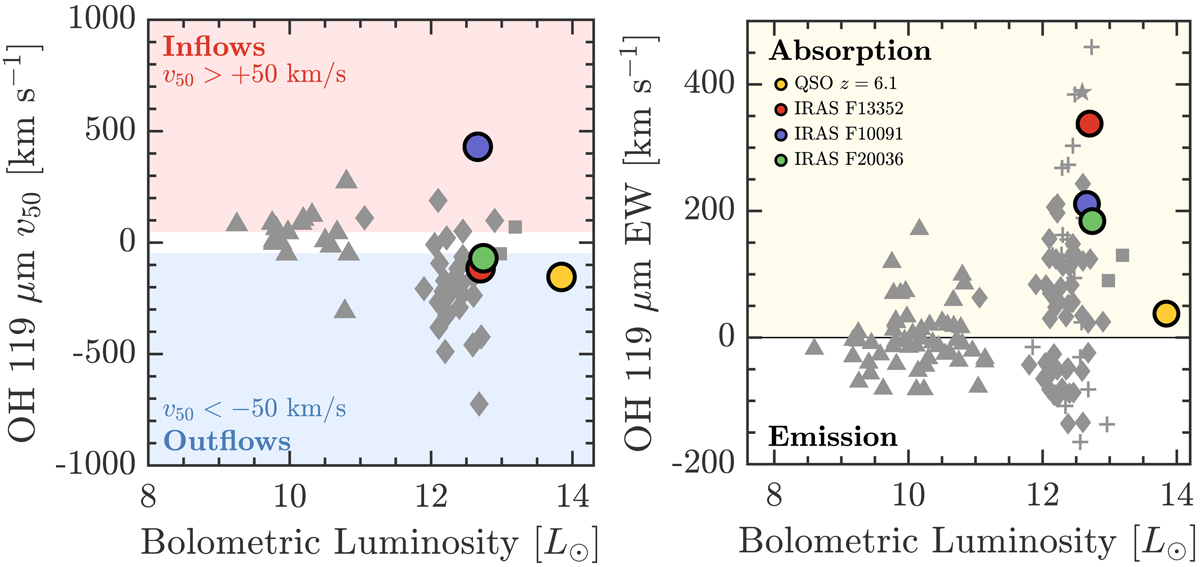
Left: OH 119 μm line median velocities (v50) as a function of bolometric luminosity. Following the criteria by Rupke et al. (2005), we classify gas with median velocity v50 > +50 km s−1 as inflows (top, in red) and gas with v50 < −50 km s−1 as outflows (bottom, in blue). Each galaxy is represented by a symbol: those in our sample are shown as colored circles, and additional samples of nearby AGNs, (U)LIRGs and QSOs, and z ∼ 0.3 HyLIRGs are shown as triangles, diamonds, and squares, respectively. The OH 119 μm line median velocities and bolometric luminosities of these galaxies are drawn from Stone et al. (2016), Veilleux et al. (2013), and Calderón et al. (2016). Right: OH 119 μm equivalent width as a function of bolometric luminosity. The samples of galaxies and the symbols are the same as in the left panel with the addition of the sample of ULIRGs from Spoon et al. (2013) shown as crosses.
Current usage metrics show cumulative count of Article Views (full-text article views including HTML views, PDF and ePub downloads, according to the available data) and Abstracts Views on Vision4Press platform.
Data correspond to usage on the plateform after 2015. The current usage metrics is available 48-96 hours after online publication and is updated daily on week days.
Initial download of the metrics may take a while.