Fig. 5.
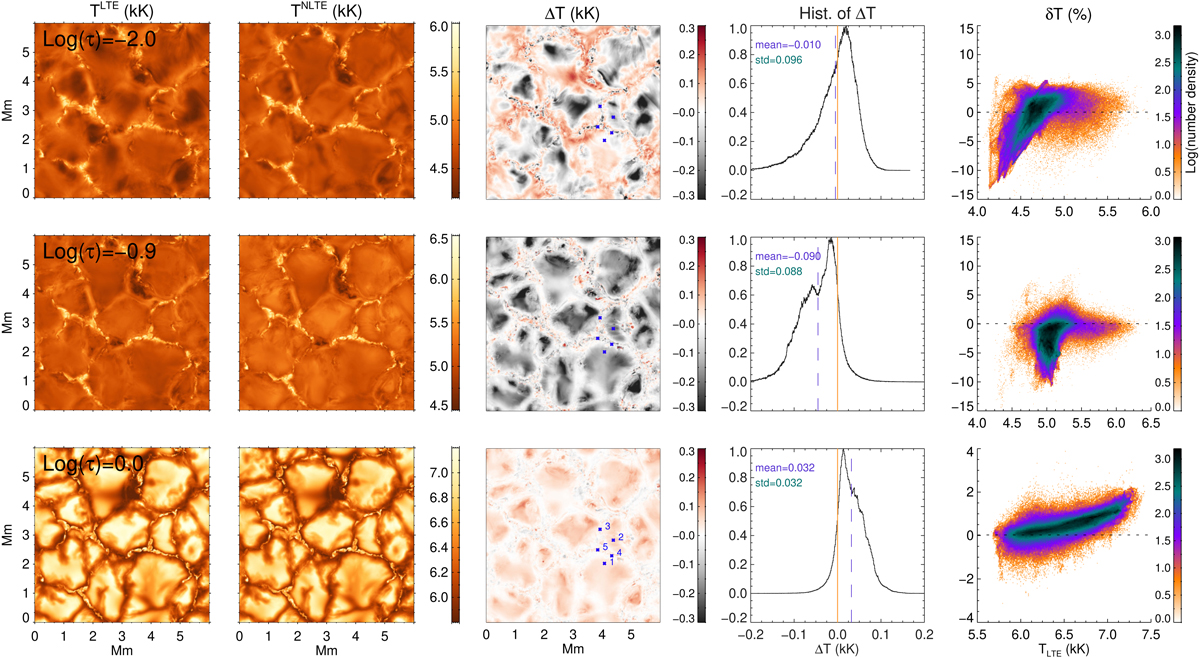
Comparison between the temperature maps from the inversion of LTE (first column) and NLTE (second column) Stokes profiles at the three nodes log(τ) = − 2.0 (top row), −0.9 (middle row), and 0.0 (bottom row). Difference in temperature between the first two columns (ΔT) and normalized histograms of these differences are shown in the third and fourth columns. The mean and standard deviation of the histogram distributions are indicated (in units of kK). The position of mean is indicated by the vertical dashed line plotted over the histogram. In the fifth column, we show the relative difference δT computed using Eq. (2), expressed in percentage, as a function of temperature from the inversion of LTE profiles which is used as reference.
Current usage metrics show cumulative count of Article Views (full-text article views including HTML views, PDF and ePub downloads, according to the available data) and Abstracts Views on Vision4Press platform.
Data correspond to usage on the plateform after 2015. The current usage metrics is available 48-96 hours after online publication and is updated daily on week days.
Initial download of the metrics may take a while.