Fig. 3
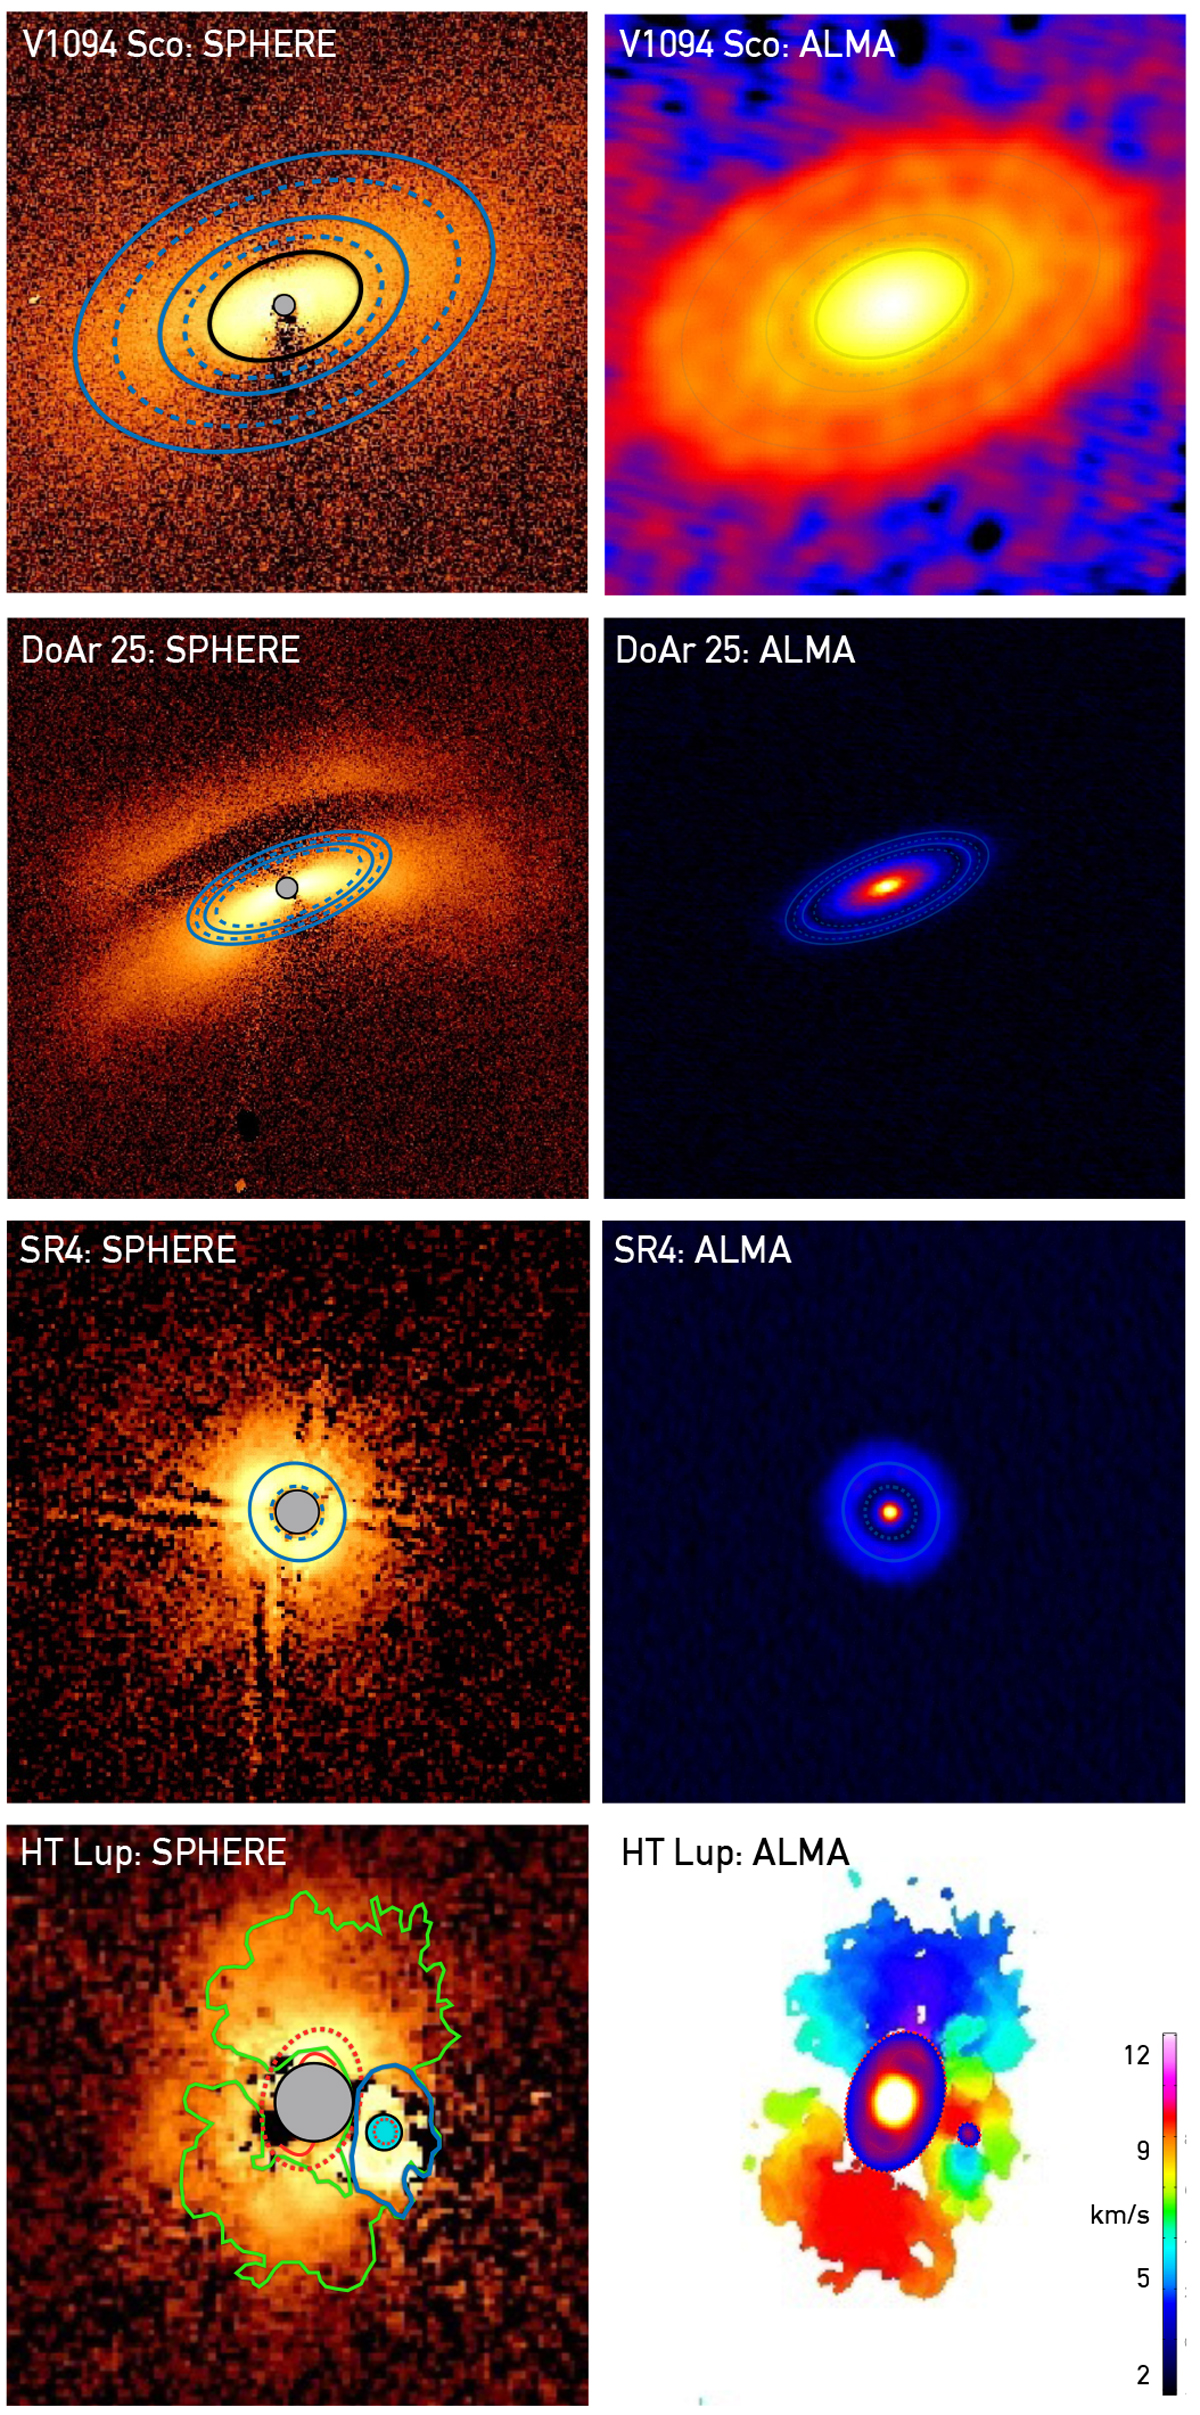
Comparison with ALMA images in Band 6. First three rows: SPHERE images of V1094 Sco, DoAr 25, and SR4 (left) compared with the continuum ALMA images (right). Rings and gaps from the ALMA image are plotted on top of the SPHERE image with full and dashed lines, respectively. The black line in V1094 Sco indicates the inner core. Bottom row: SPHERE image of HT Lup (left) compared with the continuum (inset ellipses) and 12CO emission (main figure) from ALMA (right). The color wedge delineates the 12CO emission. The red, green, and blue lines in the SPHERE image represent the outer edges of the continuum emission, the total disk CO emission, and CO emission associated with the B star, respectively.
Current usage metrics show cumulative count of Article Views (full-text article views including HTML views, PDF and ePub downloads, according to the available data) and Abstracts Views on Vision4Press platform.
Data correspond to usage on the plateform after 2015. The current usage metrics is available 48-96 hours after online publication and is updated daily on week days.
Initial download of the metrics may take a while.