Fig. 1
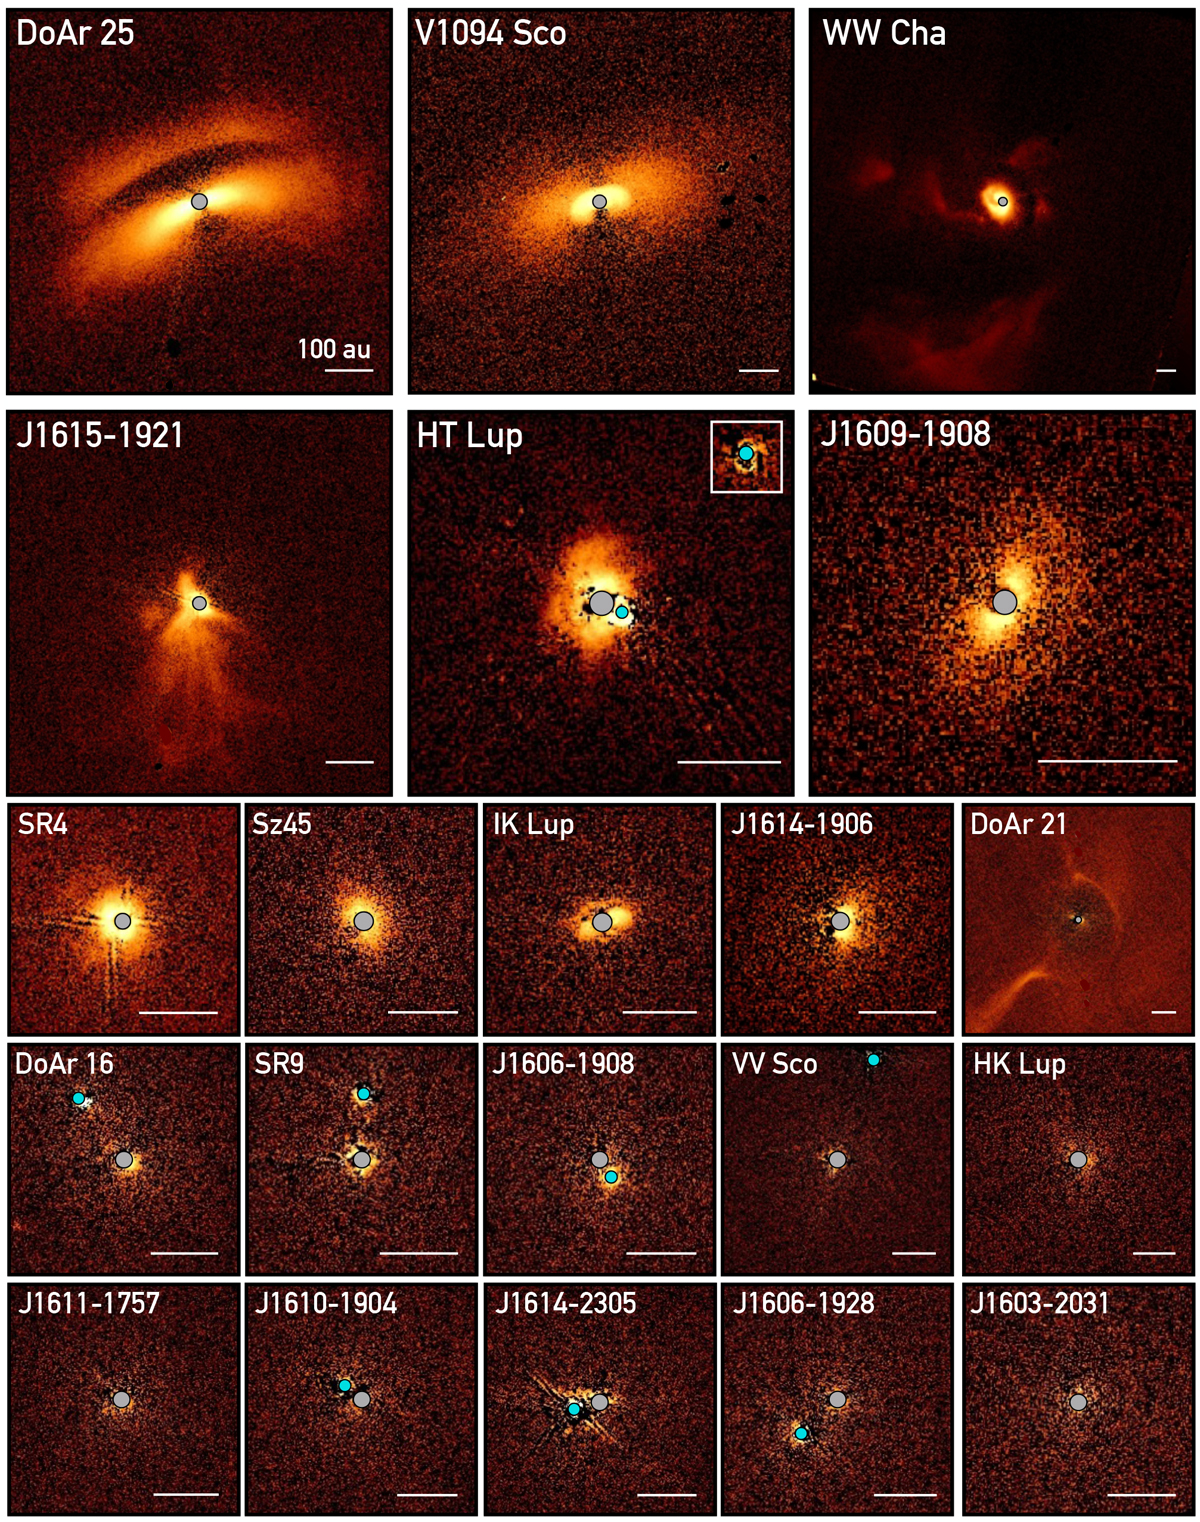
Overview of the sample. For each target, the Qϕ image in the H band is shown. First two rows: host disks with clearly visible substructures, the third row: contains disks with no or marginal evidence of substructures, and the last two rows: non-detections. The horizontal bars indicate a physical scale of 100 au. The main star is behind the gray circle in the center, symbolizing the coronagraph. Stellar companions are indicated by cyan circles. Each image has a different logarithmic color scale, chosen to highlight all relevant features. The C component of HT Lup is shown in the inset image, although the star would lie outside of the box. North is up, and east is left.
Current usage metrics show cumulative count of Article Views (full-text article views including HTML views, PDF and ePub downloads, according to the available data) and Abstracts Views on Vision4Press platform.
Data correspond to usage on the plateform after 2015. The current usage metrics is available 48-96 hours after online publication and is updated daily on week days.
Initial download of the metrics may take a while.