Free Access
Fig. 4.
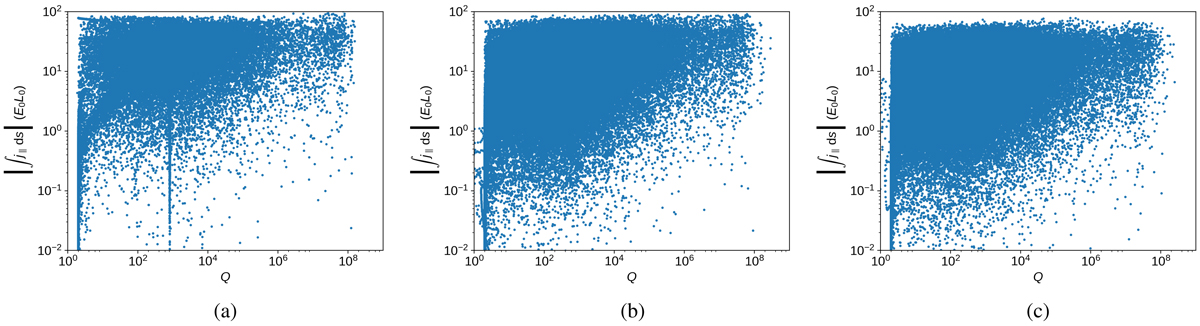
Quasi-squashing factor Q found in the mid-plane, at (a) t = 200, (b) t = 325, and (c) t = 400. We have taken the maximum of the values with respect to the bottom and top planes. The contours are shaded according to the logarithmic scale on the colour bar.
Current usage metrics show cumulative count of Article Views (full-text article views including HTML views, PDF and ePub downloads, according to the available data) and Abstracts Views on Vision4Press platform.
Data correspond to usage on the plateform after 2015. The current usage metrics is available 48-96 hours after online publication and is updated daily on week days.
Initial download of the metrics may take a while.