Fig. 1.
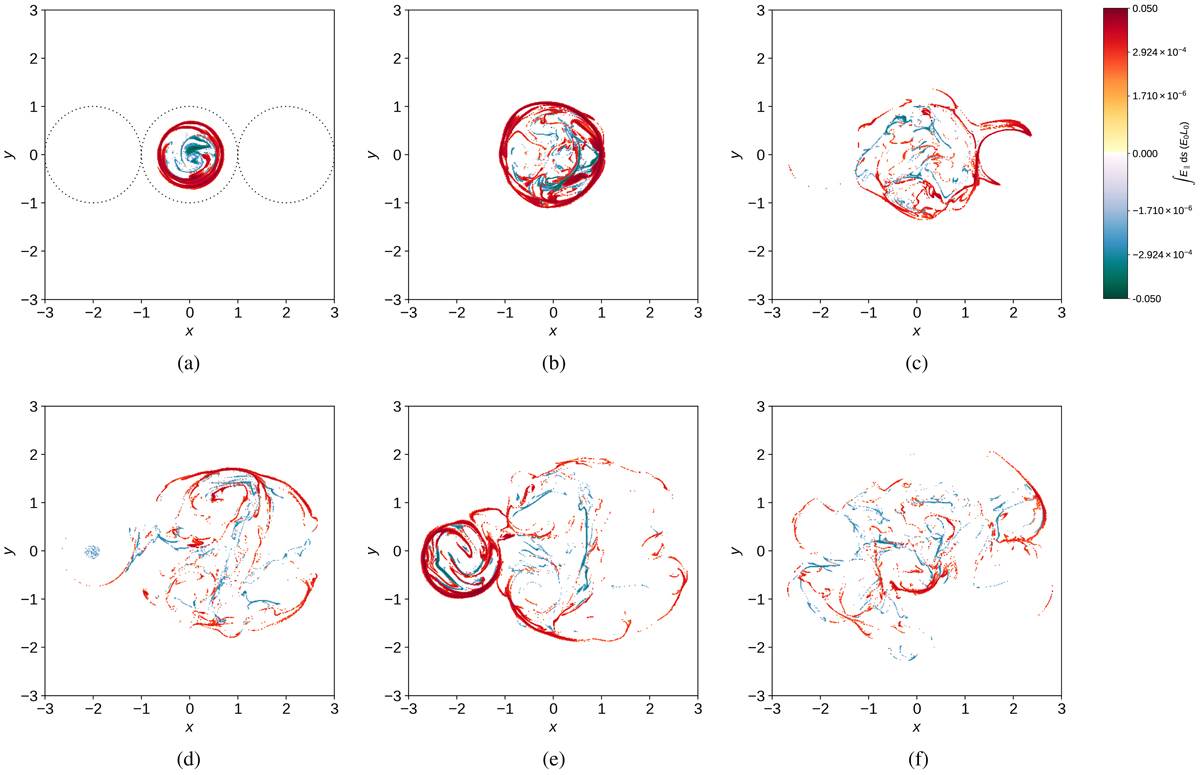
Contours of the field-line-integrated parallel electric field, plotted where field lines intersect the mid-plane. Times shown are (a) t = 175, (b) t = 200, (c) t = 225, (d) t = 275, (e) t = 325, and (f) t = 400. Times (b), (e), and (f) are subsequently considered in greater detail. In (a), the dashed black lines indicate the radii of the driven regions, representing footpoints of the left, central, and right threads. The contours are shaded according to the logarithmic scale on the colour bar.
Current usage metrics show cumulative count of Article Views (full-text article views including HTML views, PDF and ePub downloads, according to the available data) and Abstracts Views on Vision4Press platform.
Data correspond to usage on the plateform after 2015. The current usage metrics is available 48-96 hours after online publication and is updated daily on week days.
Initial download of the metrics may take a while.