Free Access
Fig. 2.
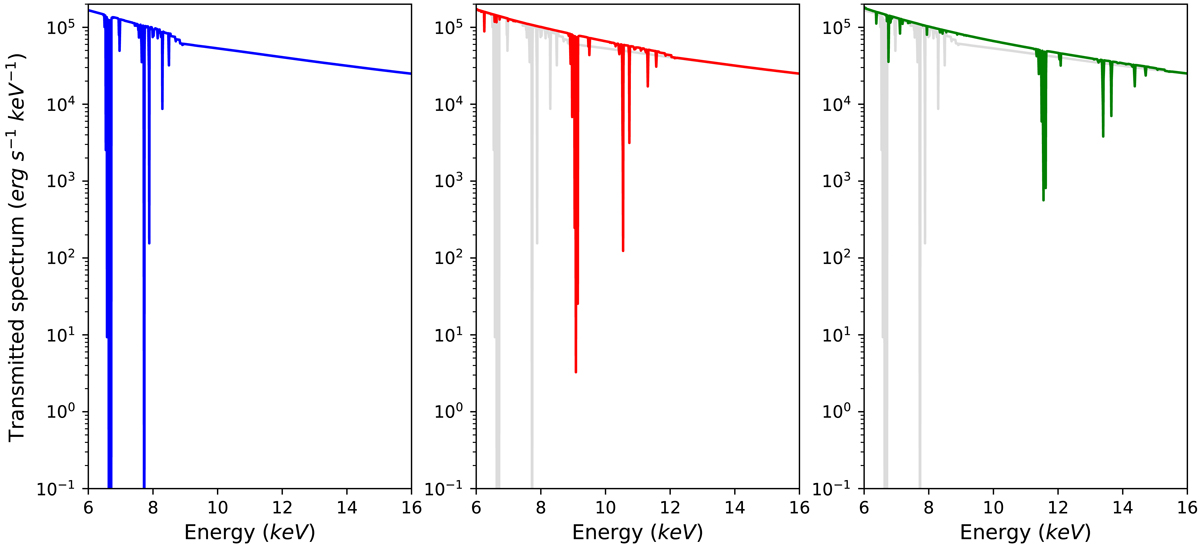
Absorption spectra for increasing outflow velocity: vout = 0.00 (left panel), = 0.30 (centre panel), = 0.50c (right panel). For comparison, in the centre and right panels we show the absorption spectrum for vout = 0.00c (in light grey). See Sect. 3 for details on the spectral parameters used in this simulation.
Current usage metrics show cumulative count of Article Views (full-text article views including HTML views, PDF and ePub downloads, according to the available data) and Abstracts Views on Vision4Press platform.
Data correspond to usage on the plateform after 2015. The current usage metrics is available 48-96 hours after online publication and is updated daily on week days.
Initial download of the metrics may take a while.