Fig. 8.
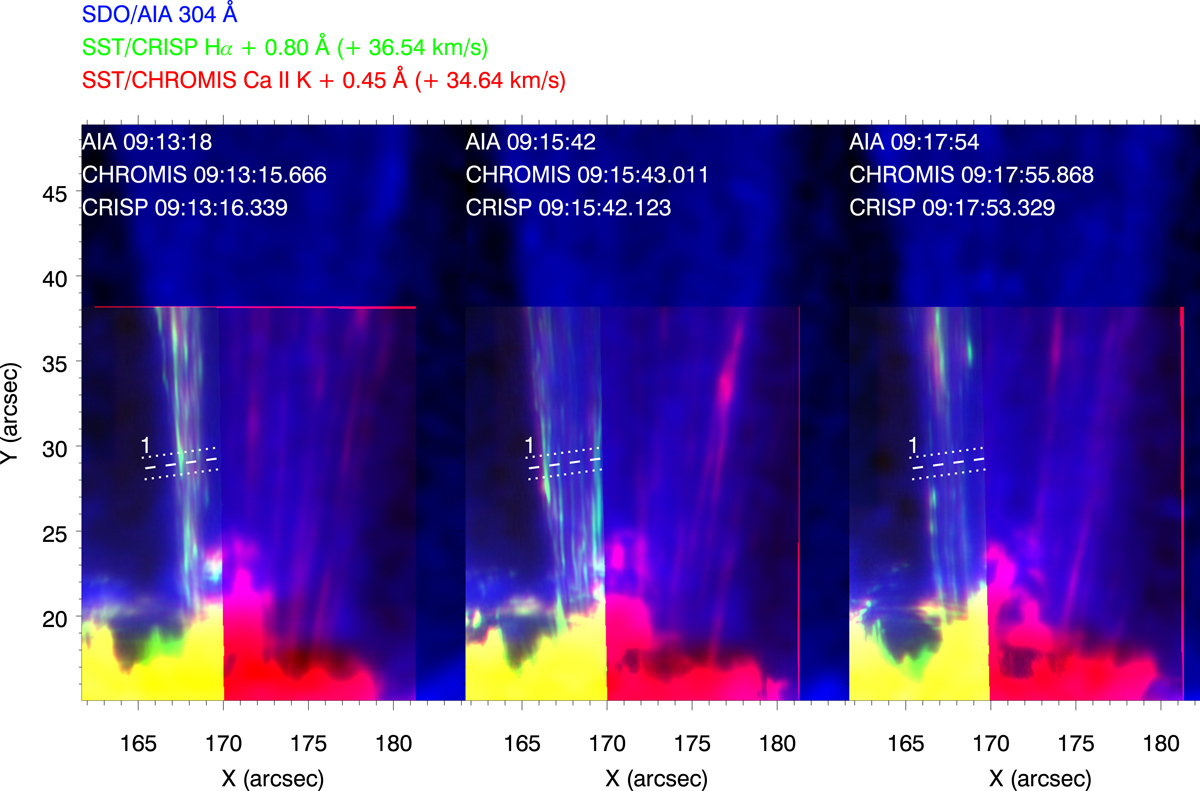
Close-up on the northern leg of the loop bundle showing long-period EUV pulsations. RGB images at different steps of the SST sequence. For each step we show a combination of the AIA 304 Å channel in blue, one position in the red wing (+0.80 Å) of the Hα line in green, and one position in the red wing (+0.45 Å) of the Ca II K line in red. Path 1 is displayed as a context for Fig. 9. An animation of this figure is available online.
Current usage metrics show cumulative count of Article Views (full-text article views including HTML views, PDF and ePub downloads, according to the available data) and Abstracts Views on Vision4Press platform.
Data correspond to usage on the plateform after 2015. The current usage metrics is available 48-96 hours after online publication and is updated daily on week days.
Initial download of the metrics may take a while.