Fig. 7.
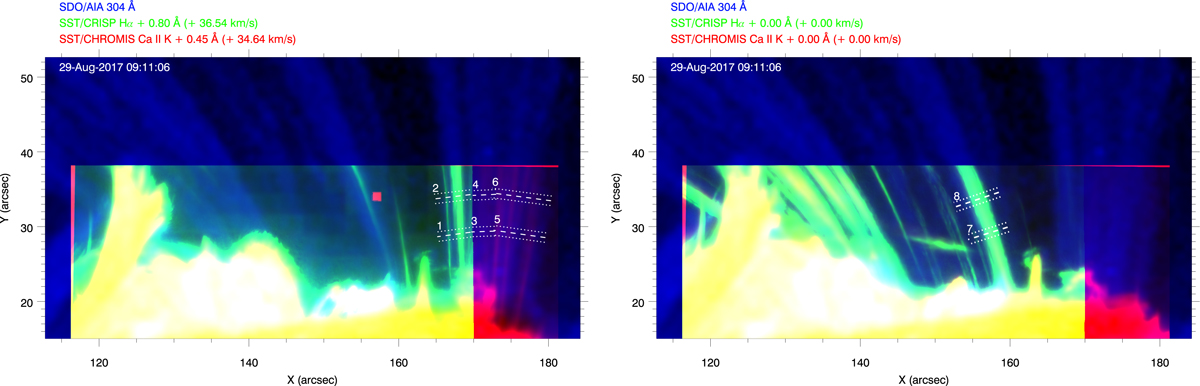
Zoom on the coronal rain in the SST FOV. Images are stacked from 09:07:06 to 09:11:06 in order to highlight the display of the different bundles. The dashed lines show the different paths chosen for the analysis and the parallel dotted lines show the thickness covered by the slices constructed around these paths. Left: RGB image combining the AIA 304 Å in blue, red wing Hα in green, and red wing Ca II K in red. Right: same FOV with Hα line center in green and Ca II K line center in red.
Current usage metrics show cumulative count of Article Views (full-text article views including HTML views, PDF and ePub downloads, according to the available data) and Abstracts Views on Vision4Press platform.
Data correspond to usage on the plateform after 2015. The current usage metrics is available 48-96 hours after online publication and is updated daily on week days.
Initial download of the metrics may take a while.