Fig. 5.
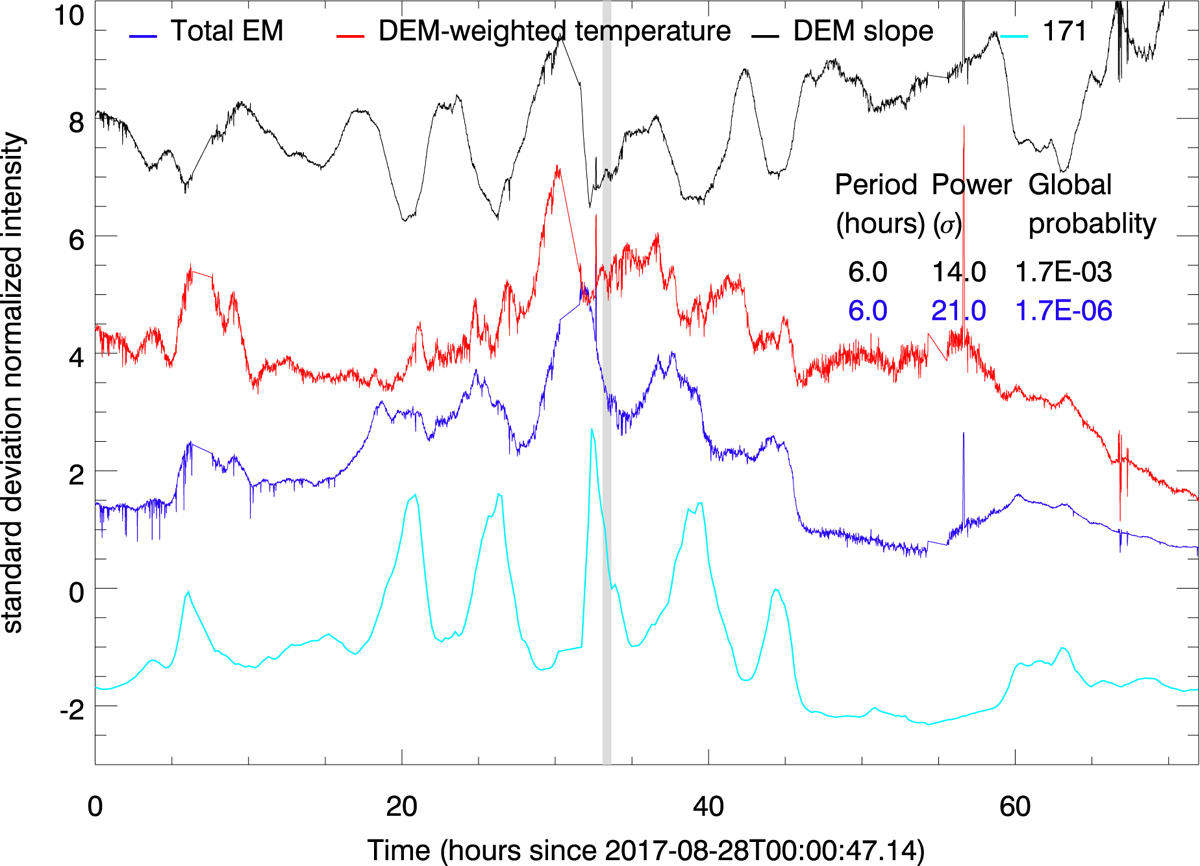
Evolution of three parameters extracted from the DEM analysis: DEM-weighted temperature, DEM slope and total Emission Measure (EM). These time series are averaged over the black contour displayed in Fig. 1. We included the 171 light curve from Fig. 2 for reference. All these quantities are normalised to the standard deviation and offset on the y-axis. If there is a detection, we display the corresponding period detected, the Fourier power and the associated random occurrence probability. The grey bar indicates the SST observations duration. An animation of this figure is available online.
Current usage metrics show cumulative count of Article Views (full-text article views including HTML views, PDF and ePub downloads, according to the available data) and Abstracts Views on Vision4Press platform.
Data correspond to usage on the plateform after 2015. The current usage metrics is available 48-96 hours after online publication and is updated daily on week days.
Initial download of the metrics may take a while.