Fig. 4.
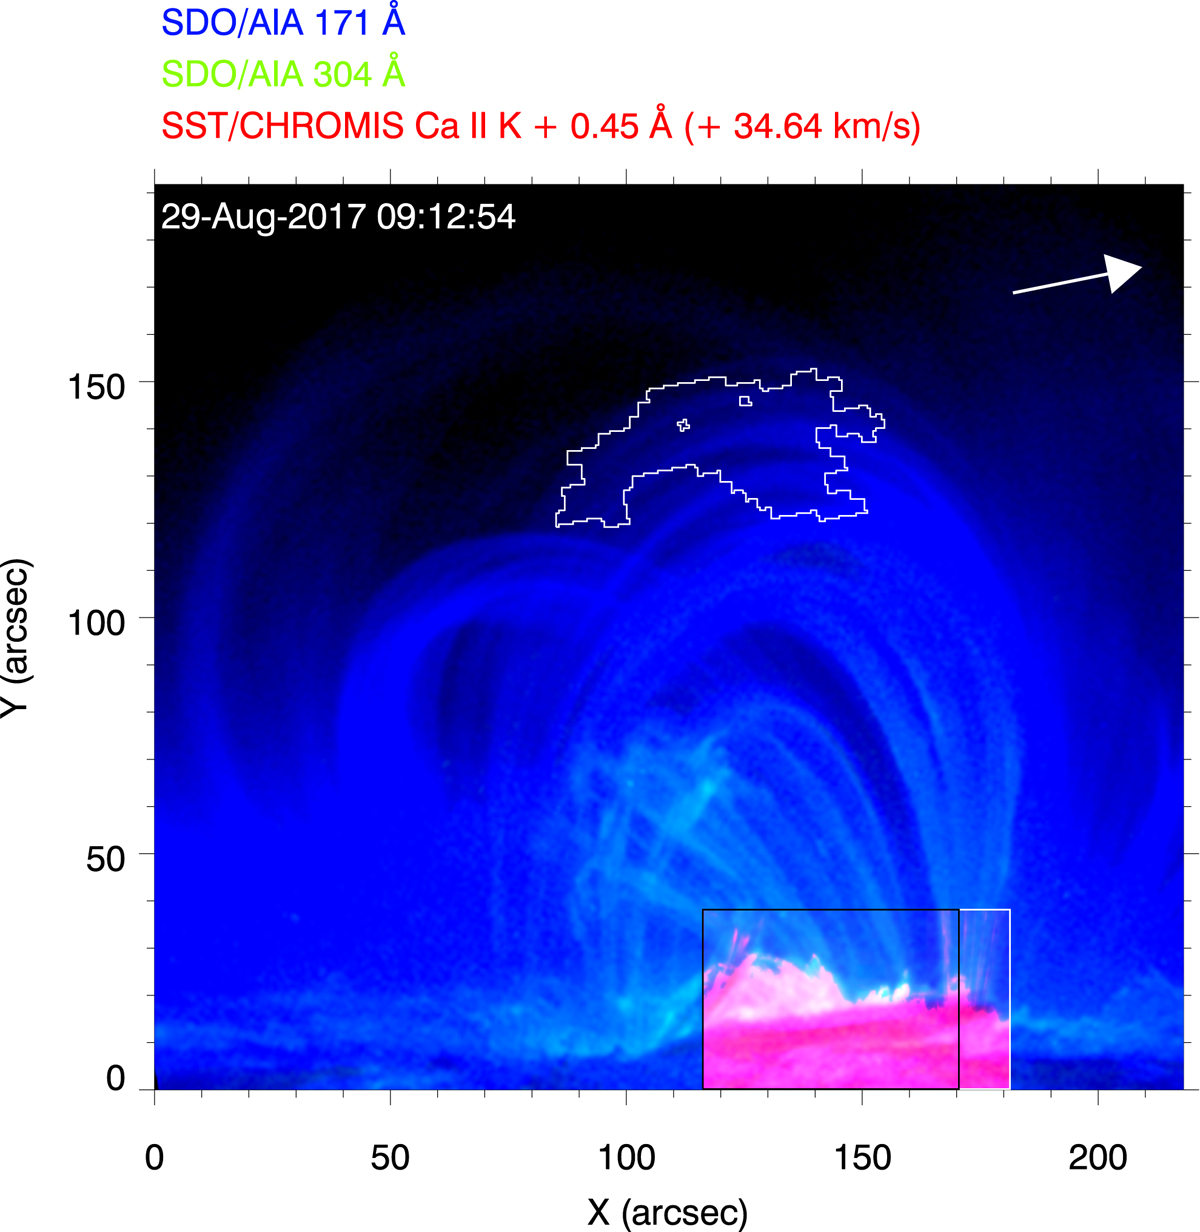
RGB image combining two AIA channels: 171 Å in blue and 304 Å in green and one position in the red wing (+0.45 Å) of the Ca II K line scanned with CHROMIS in red. The white contour represent the regions detected with normalised power above 10σ (i.e. the same contour as the black one in Fig. 1). The black and white boxes represent, respectively, the FOV of the CRISP and CHROMIS instruments at the beginning of the SST observations. The white arrow indicates the north direction. The image is rotated compared to the one of Fig. 1 for convenience. An animation of this figure is available online.
Current usage metrics show cumulative count of Article Views (full-text article views including HTML views, PDF and ePub downloads, according to the available data) and Abstracts Views on Vision4Press platform.
Data correspond to usage on the plateform after 2015. The current usage metrics is available 48-96 hours after online publication and is updated daily on week days.
Initial download of the metrics may take a while.