Fig. 3.
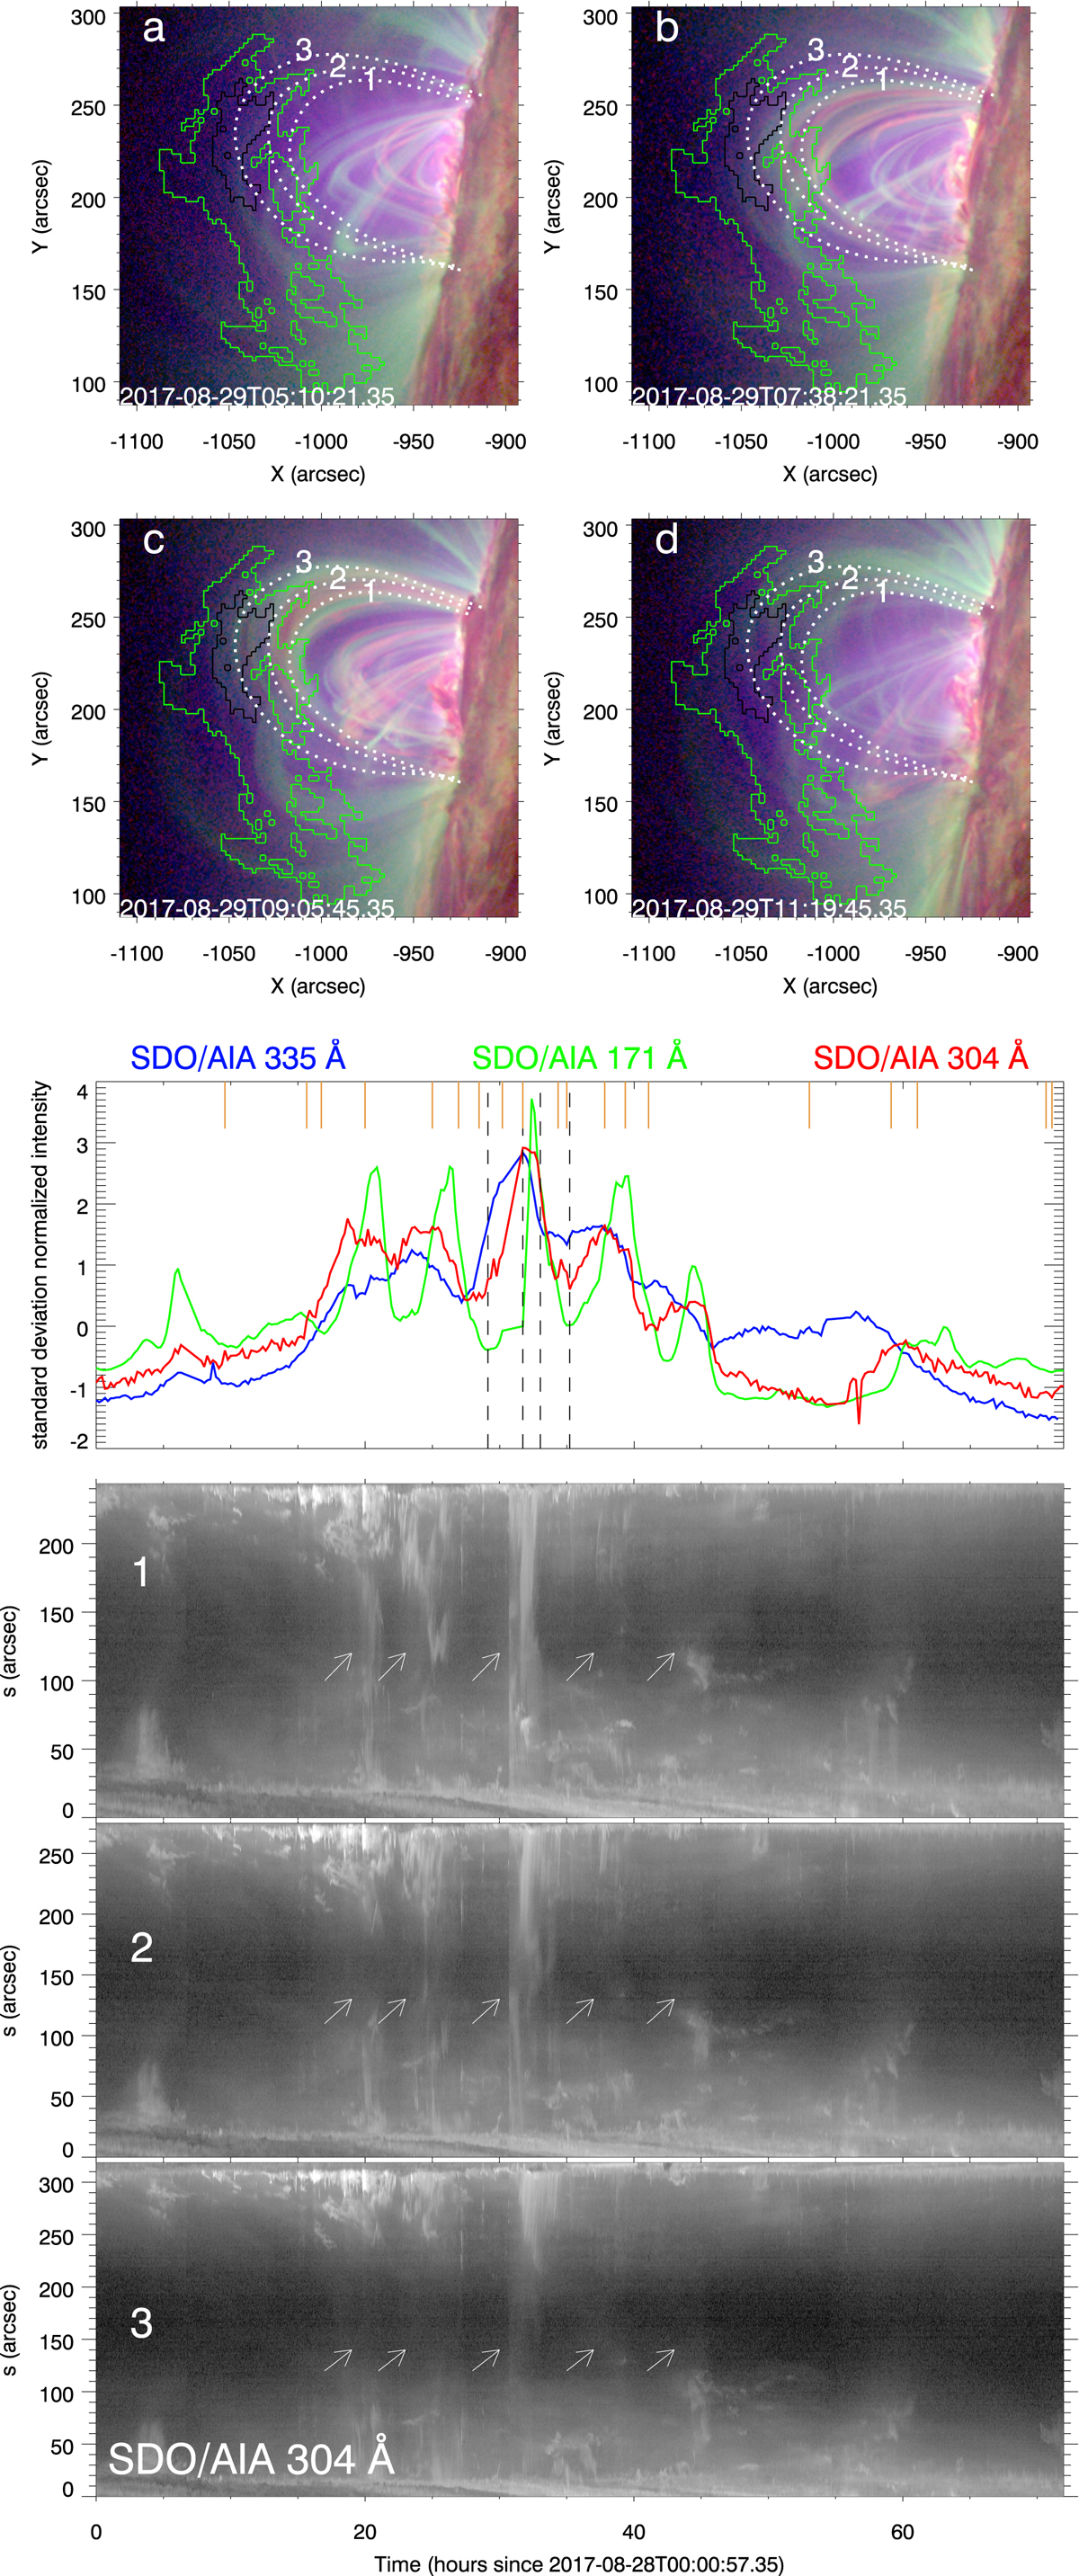
Periodic coronal rain and coronal emission in the 304 channel. Top: four stages observed during the third rain cycle (details in Sect. 2.1.3). RGB images combining the 335 Å AIA channel in blue, 171 Å in green and 304 Å in red. The green and black contours are, respectively, the 5σ and 10σ contours of detection. Middle: evolution of the intensity for the same three channels (same light curves as in Fig. 2). The four vertical dotted black lines mark the time of the four images of the figure. The small orange vertical solid lines mark the approximate time for some of the flares occurring during the sequence. Bottom: time-distance plots taken along the three dotted lines shown in the top panel. The origin of the y-axes is the northern footpoint of the lines. The white arrows points out the five cycles. An animation of this figure is available online.
Current usage metrics show cumulative count of Article Views (full-text article views including HTML views, PDF and ePub downloads, according to the available data) and Abstracts Views on Vision4Press platform.
Data correspond to usage on the plateform after 2015. The current usage metrics is available 48-96 hours after online publication and is updated daily on week days.
Initial download of the metrics may take a while.