Fig. 10.
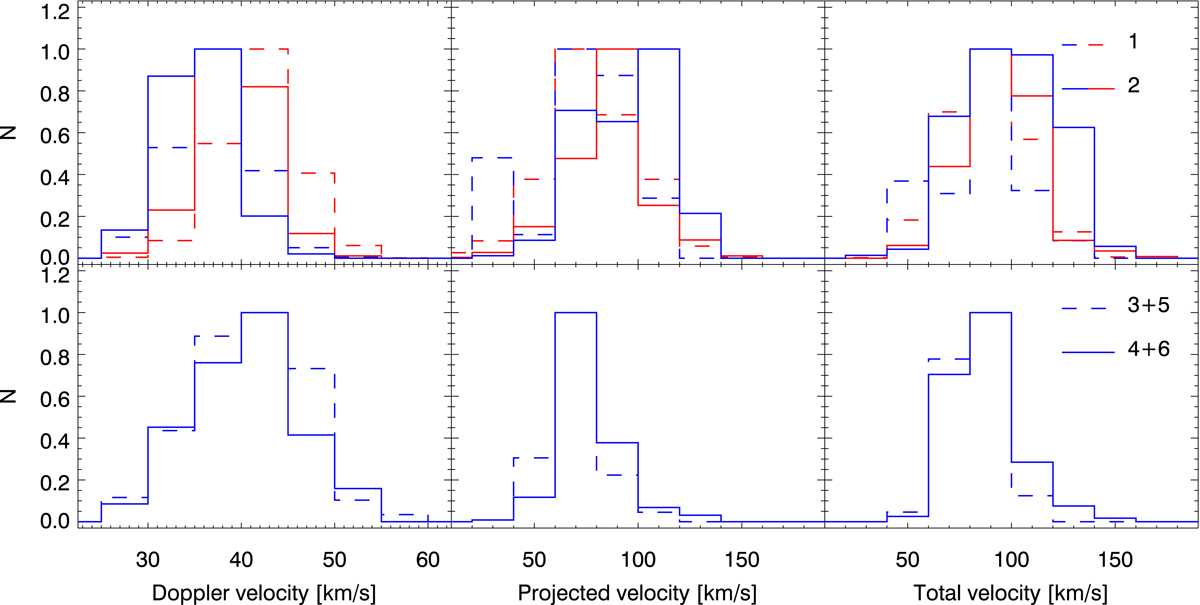
Normalised histograms of the velocities for the rain in the pulsating loop bundle. From left to right: Doppler velocity, projected velocity, and total velocity. We only show the measurements that have an error below 15% of the measured value. in blue for Ca II K. Bottom row: measurements for paths only covered by CHROMIS (Ca II K). Paths 3 and 5, and 4 and 6 are combined given the small number of rain pixels in paths 3 and 4.
Current usage metrics show cumulative count of Article Views (full-text article views including HTML views, PDF and ePub downloads, according to the available data) and Abstracts Views on Vision4Press platform.
Data correspond to usage on the plateform after 2015. The current usage metrics is available 48-96 hours after online publication and is updated daily on week days.
Initial download of the metrics may take a while.