Fig. 1.
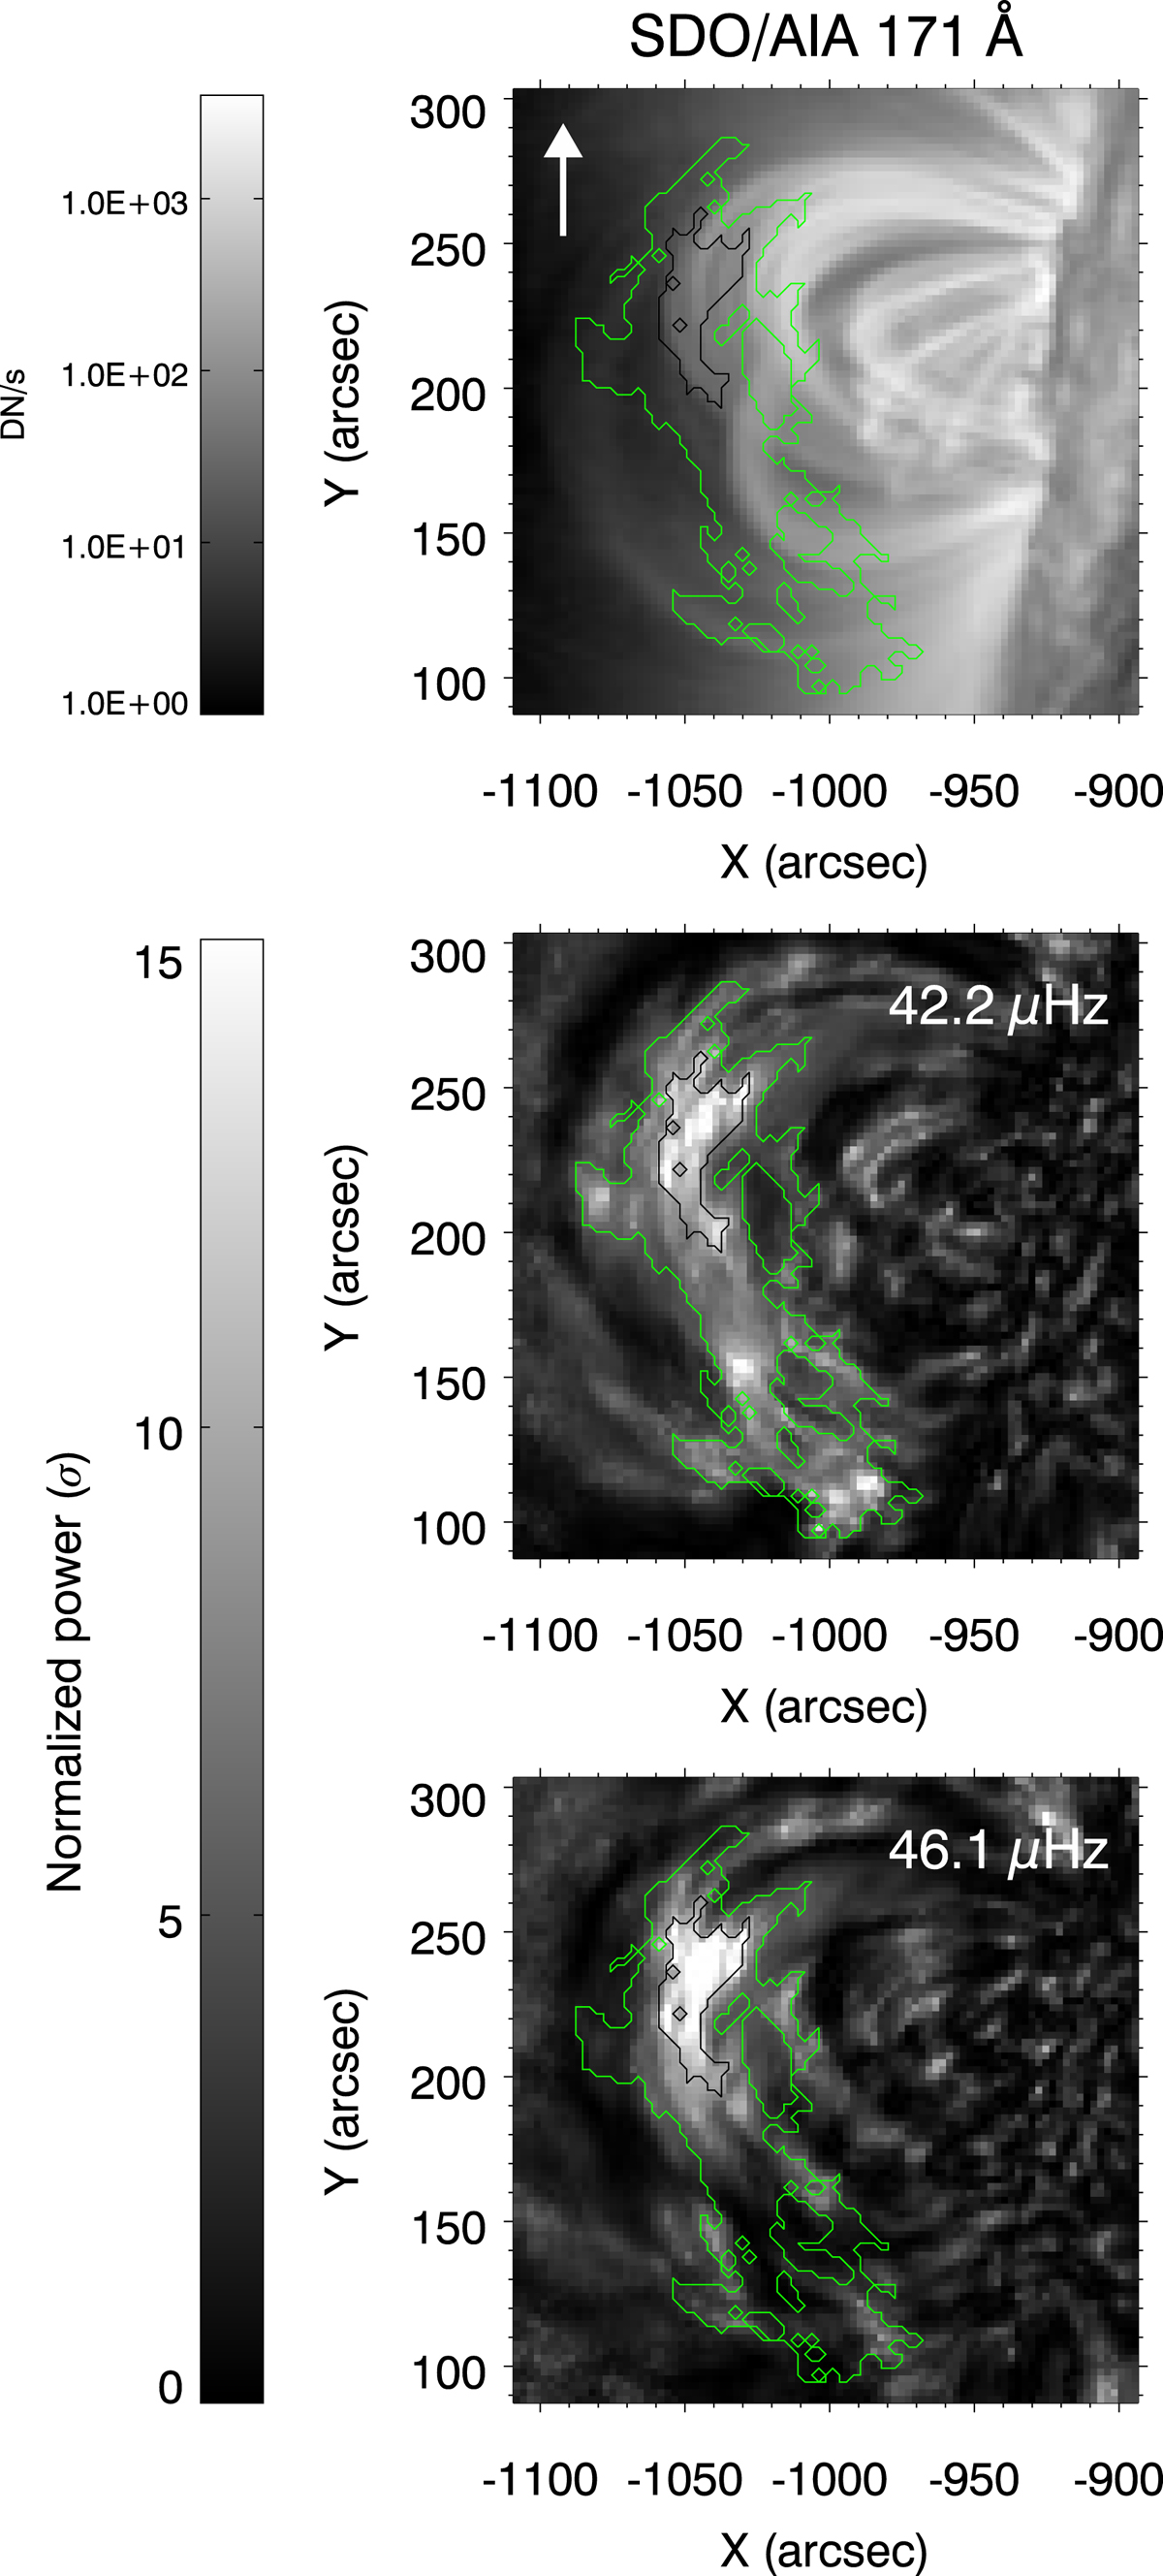
Top: 171 Å image at August 29, 2017 08:49:45 of the SDO/AIA ROI just before the beginning of the SST dataset. The green and black contour represent, respectively, the regions detected with normalised power above 5σ (extended contour) and 10σ. The white arrow indicates the north direction. Middle: normalised power map at 42.2 μHz (i.e. 6.6 h) for the 171 time series. Bottom: normalised power map at 46.1 μHz (i.e. 6.0 h) for the 171 time series. The scale is saturated to 15σ for both frequency bands.
Current usage metrics show cumulative count of Article Views (full-text article views including HTML views, PDF and ePub downloads, according to the available data) and Abstracts Views on Vision4Press platform.
Data correspond to usage on the plateform after 2015. The current usage metrics is available 48-96 hours after online publication and is updated daily on week days.
Initial download of the metrics may take a while.