Fig. 13.
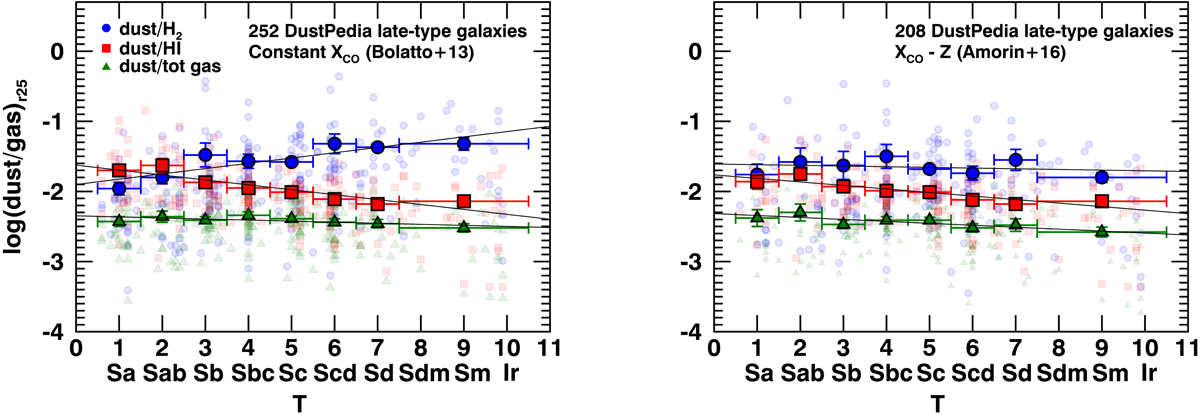
Left panel: dust-to-total gas mass ratio as a function of the molecular-to-atomic gas mass ratio within r25 for the gas sample. The small, transparent green circles and red squares are data points assuming a constant and a metallicity-dependent XCO, respectively. These data points are drawn without error bars. The large symbols are the means of y-axis values in bins of x-axis values. Right panel: same as left panel, under the assumption of the constant XCO and displaying data points as a function of morphological stage (four main bins in galaxy morphology).
Current usage metrics show cumulative count of Article Views (full-text article views including HTML views, PDF and ePub downloads, according to the available data) and Abstracts Views on Vision4Press platform.
Data correspond to usage on the plateform after 2015. The current usage metrics is available 48-96 hours after online publication and is updated daily on week days.
Initial download of the metrics may take a while.