Fig. 1.
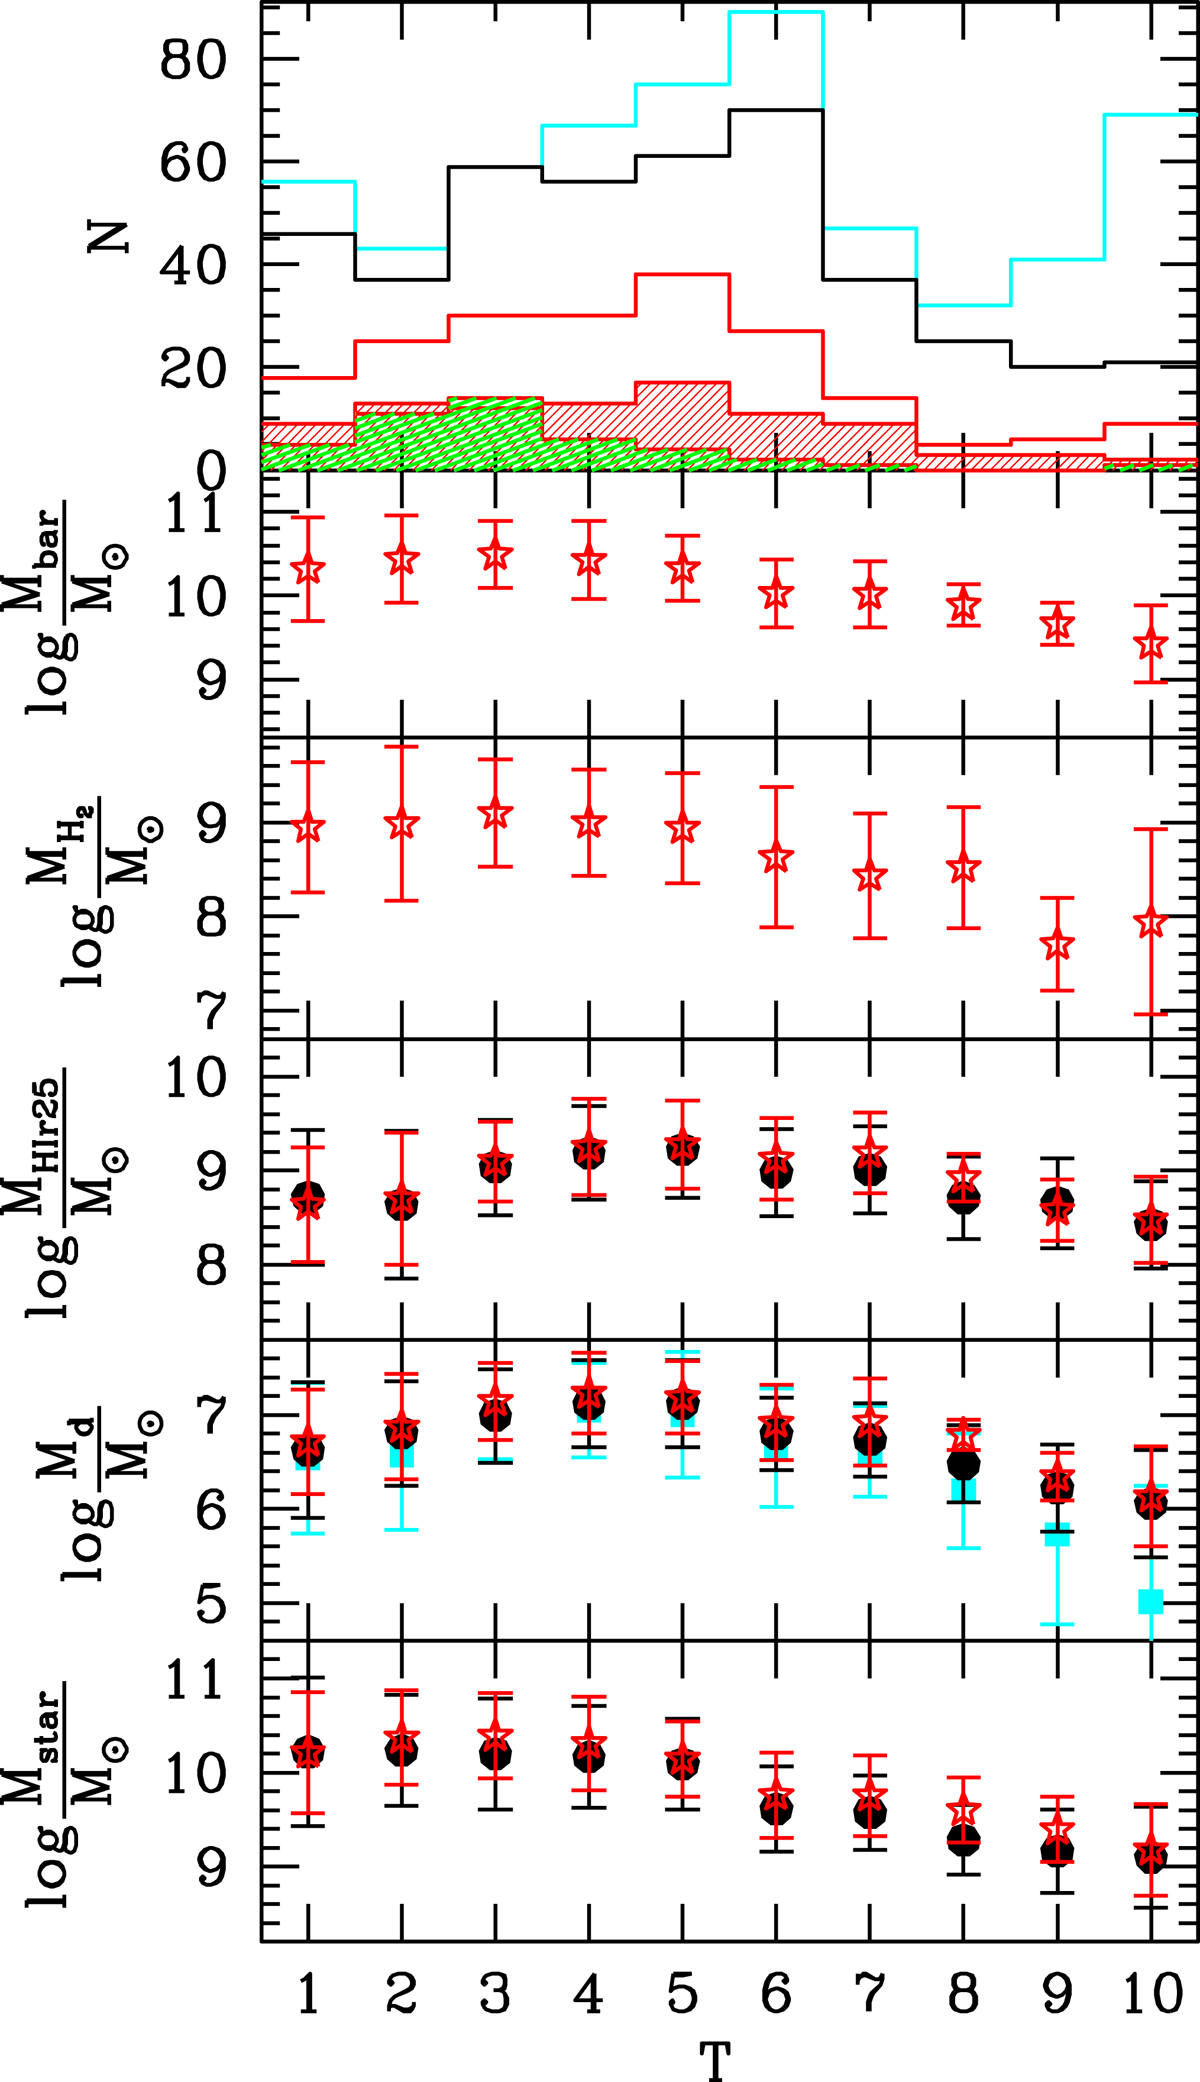
Number of galaxies and the mean of the log of baryonic, H2, HI, dust, and stellar masses as a function of morphological stage in our main sample (black lines and filled dots) and in the gaseous sample (red lines and stars symbols). The H I gas mass shown is inside r25. We have not corrected gas masses for helium except for the baryonic masses which include the atomic gas beyond r25. The shaded red and green areas in the upper panel point out the distribution of the number of interacting (92) and active (44 AGN or starbursts) galaxies, respectively, in the gaseous sample. We also show the number of objects and the dust mass distribution for all DustPedia galaxies (cyan lines and filled squares).
Current usage metrics show cumulative count of Article Views (full-text article views including HTML views, PDF and ePub downloads, according to the available data) and Abstracts Views on Vision4Press platform.
Data correspond to usage on the plateform after 2015. The current usage metrics is available 48-96 hours after online publication and is updated daily on week days.
Initial download of the metrics may take a while.