Fig. D.1.
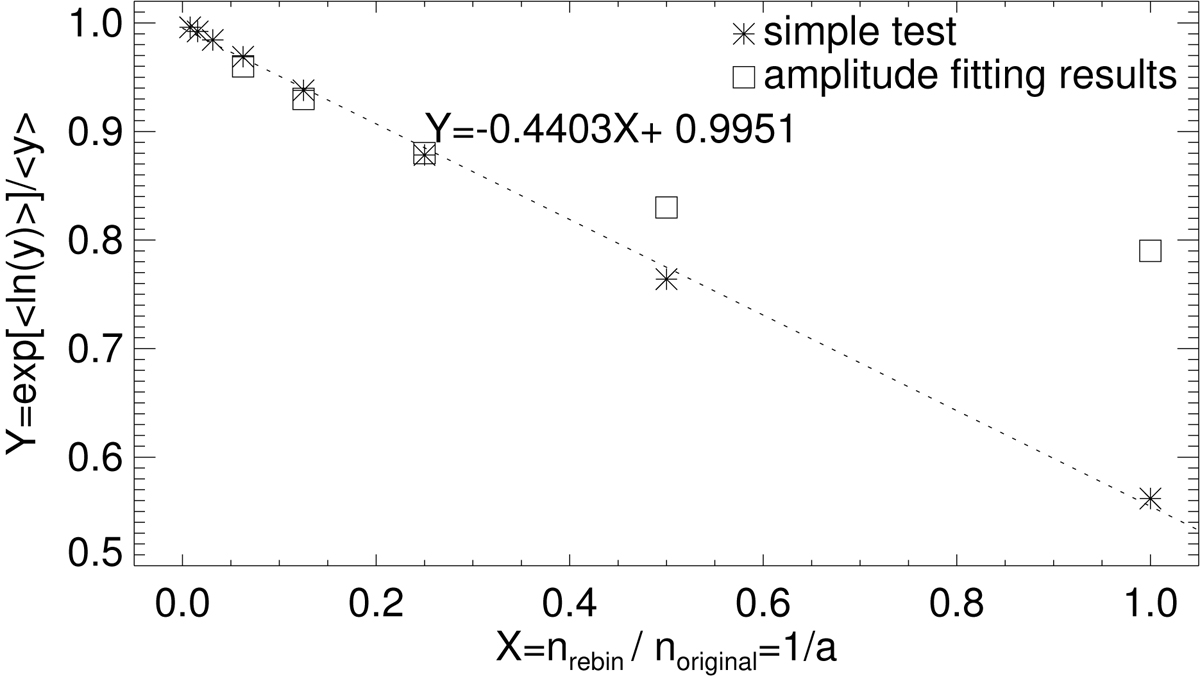
exp⟨ln(y)⟩/⟨y⟩, where y is the a-element average of chi-square distributed random variables, as a function of the pixel number ratio of the rebinned data to the original (asterisks). The average ratio of the amplitude fitting results to the input shown in Fig. D.2 is depicted by squares. The dashed line and the equation on the panel are the linear regression of the data points.
Current usage metrics show cumulative count of Article Views (full-text article views including HTML views, PDF and ePub downloads, according to the available data) and Abstracts Views on Vision4Press platform.
Data correspond to usage on the plateform after 2015. The current usage metrics is available 48-96 hours after online publication and is updated daily on week days.
Initial download of the metrics may take a while.