Fig. 4.
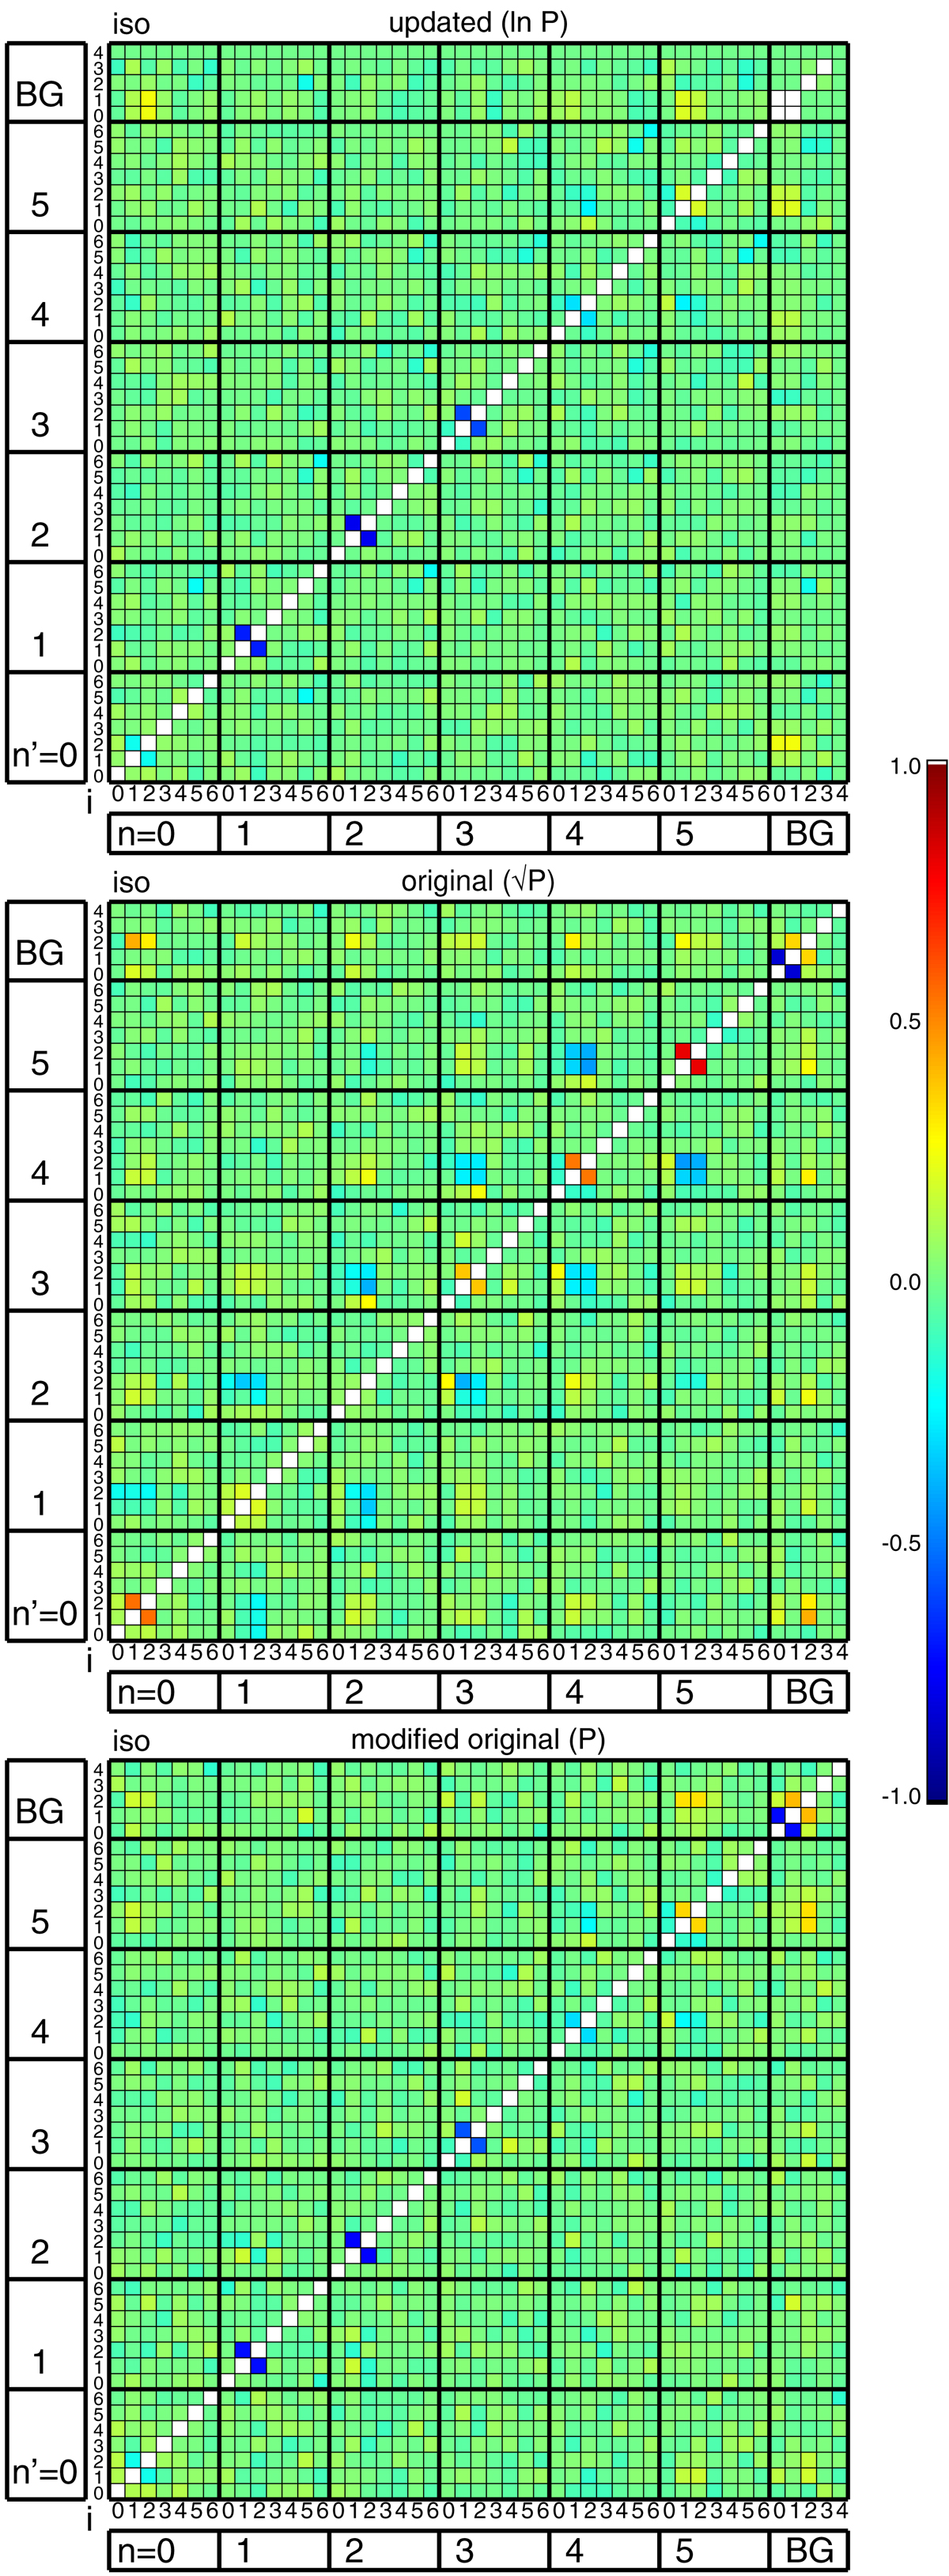
Correlation coefficients between the parameters (500 Monte-Carlo realizations) for the isotropic model (ux, n = 0 for all n) and for the isotropic model except with ux = 400 m s−1 for the n = 3 peak (on the next page) at ℓ = 492 (kpix = 21). Each box indicates the parameters for n-th peak (n = 0, 1, …5), qi, n (i = 0, …6, from left to right and from bottom to top in each box) and the background parameters (BG). As we defined in Sect. 2q0, n = νn is the frequency of the n-th peak, q1, n = An is the amplitude, q2, n = Γn is the width, q4,n) = u = (ux,n, uy,n) is the horizontal velocity, q5, n = fc, n and q6, n = fs, n are parameters to handle anisotropy. Background parameters are q0, BG = B0 is the amplitude, q1, BG = b is the power-law index, q2, BG = fc, bg and q3, BG = fs, bg are the parameters to handle the anisotropy of the background. Color scale is shown by the color bar on the right side. We note that the last columns and rows (i = 4) of BG on the top panels are empty because the number of the background parameters in the model in the updated code is four, instead of five.
Current usage metrics show cumulative count of Article Views (full-text article views including HTML views, PDF and ePub downloads, according to the available data) and Abstracts Views on Vision4Press platform.
Data correspond to usage on the plateform after 2015. The current usage metrics is available 48-96 hours after online publication and is updated daily on week days.
Initial download of the metrics may take a while.