Fig. 3.
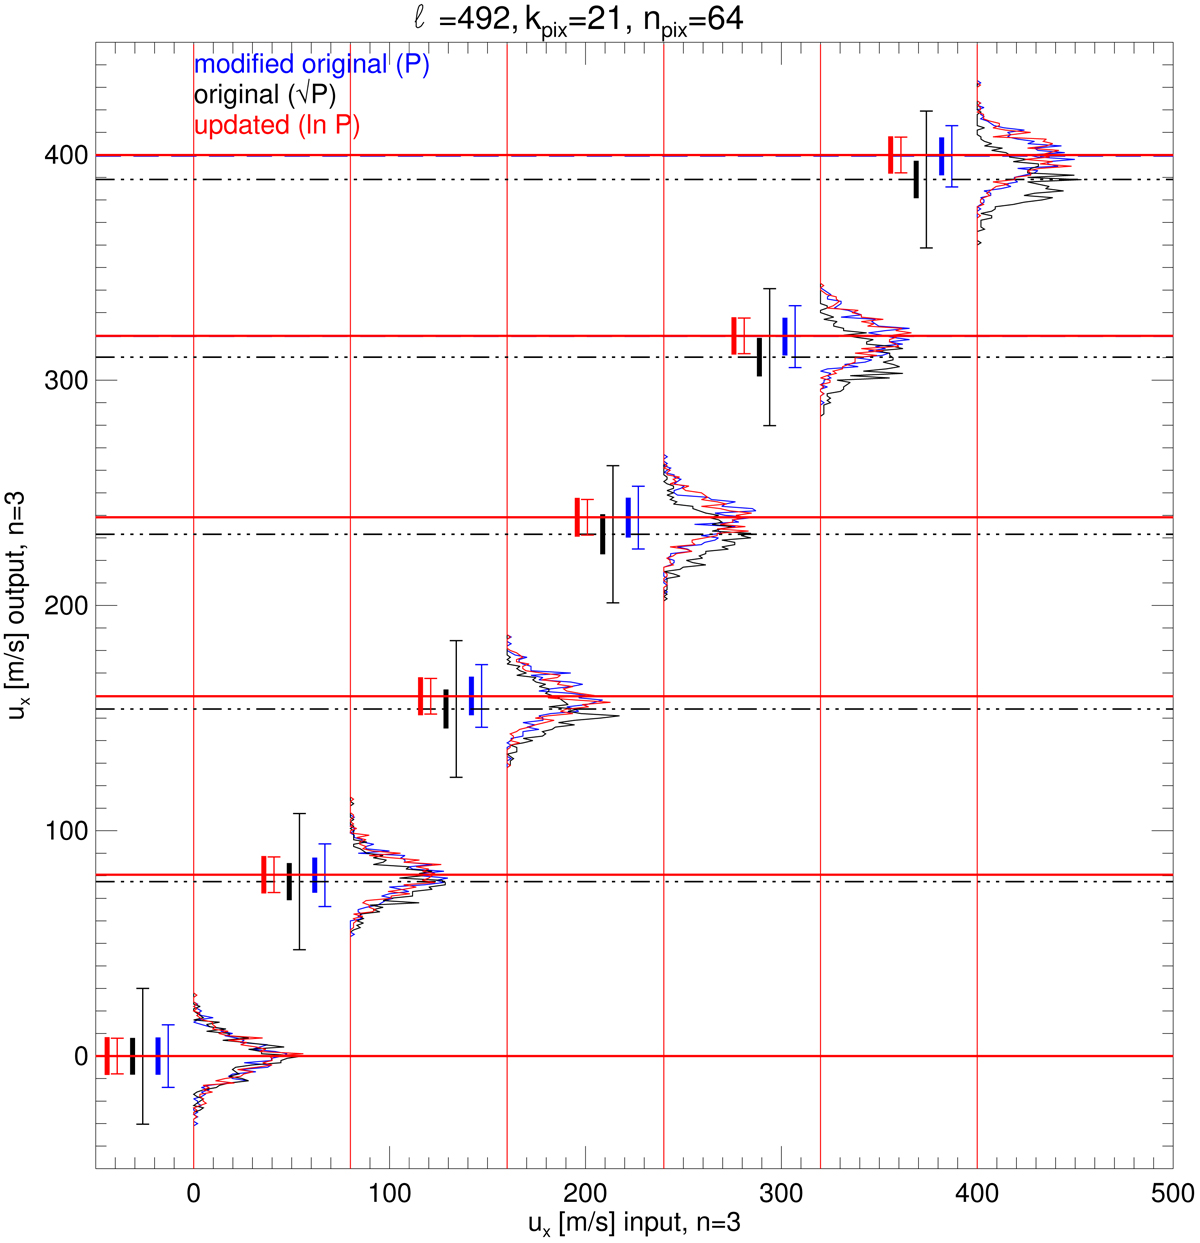
Fitting results of ux, n = 3 at ℓ = 492 (kpix = 21) in the form of normalized histograms by the original code which fit the model to the square root of power (black), the modified original code which fit the power (blue), and the updated code (red). Horizontal lines indicate the average of 500 Monte–Carlo realizations given by the three codes (in the same colors as the histograms, dash-dotted black, dashed blue, and solid red). The short vertical lines on the horizontal lines indicates the error estimated by the codes (thin lines with short horizontal bars) and the standard deviations of the 500 fitting results (thick lines) in the same color as the histograms centered at the means (horizontal lines) by the three codes. We note that the fitting results with overly large deviation are omitted. See text for details.
Current usage metrics show cumulative count of Article Views (full-text article views including HTML views, PDF and ePub downloads, according to the available data) and Abstracts Views on Vision4Press platform.
Data correspond to usage on the plateform after 2015. The current usage metrics is available 48-96 hours after online publication and is updated daily on week days.
Initial download of the metrics may take a while.