Fig. 2.
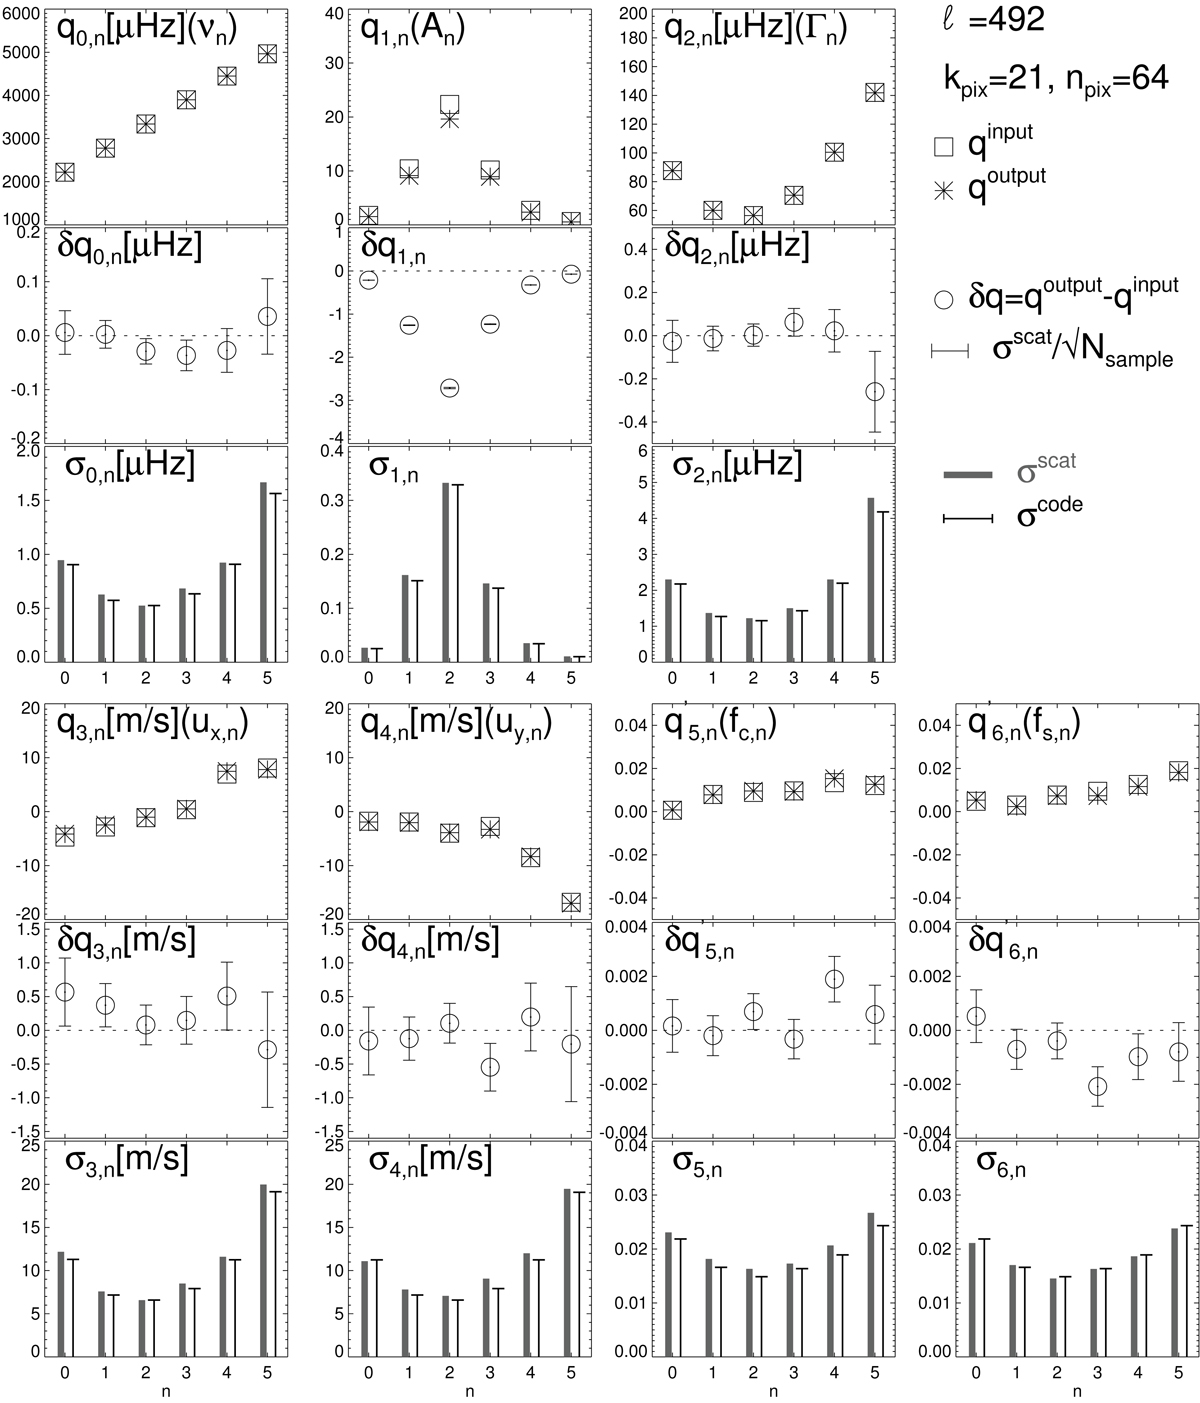
Fitting parameters and their errors for the case ℓ = 492 (kpix = 21). Each panel has three parts. In the upper part of each panel, squares indicate the input parameters, ![]() . The asterisks indicate the fitting results obtained by the updated code, namely, the mean of Monte-Carlo samples,
. The asterisks indicate the fitting results obtained by the updated code, namely, the mean of Monte-Carlo samples, ![]() . In the middle part of each panel, the deviation of the mean fitting results from the input,
. In the middle part of each panel, the deviation of the mean fitting results from the input, ![]() , are illustrated by the circles and the expected scatter of the mean computed from the square root of variance σscat of the 500 Monte Carlo samples divided by the square root of the sample number, Nsample (here it is 500) are shown as the error bars. The dashed horizontal lines are at δq = 0. In the lower part of each panel the scatter of the 500 samples, σscat and the scaled error estimated by the updated code, σcode, are depicted by the thick gray lines and the thin lines with short horizontal bars on the edge. Errors estimated by the updated code are scaled by σ(α = 1.5, kpix, npix) = 0.569 as described in Appendix B.2. The error bars on the middle panel of δq1, n are tiny at this scale; the underestimation is relatively large. However, the errors of δq1, n are
, are illustrated by the circles and the expected scatter of the mean computed from the square root of variance σscat of the 500 Monte Carlo samples divided by the square root of the sample number, Nsample (here it is 500) are shown as the error bars. The dashed horizontal lines are at δq = 0. In the lower part of each panel the scatter of the 500 samples, σscat and the scaled error estimated by the updated code, σcode, are depicted by the thick gray lines and the thin lines with short horizontal bars on the edge. Errors estimated by the updated code are scaled by σ(α = 1.5, kpix, npix) = 0.569 as described in Appendix B.2. The error bars on the middle panel of δq1, n are tiny at this scale; the underestimation is relatively large. However, the errors of δq1, n are ![]() and, therefore, available from σscat in the lower panel and Nsample = 500; they are ∼0.02 at most.
and, therefore, available from σscat in the lower panel and Nsample = 500; they are ∼0.02 at most.
Current usage metrics show cumulative count of Article Views (full-text article views including HTML views, PDF and ePub downloads, according to the available data) and Abstracts Views on Vision4Press platform.
Data correspond to usage on the plateform after 2015. The current usage metrics is available 48-96 hours after online publication and is updated daily on week days.
Initial download of the metrics may take a while.