Fig. 1.
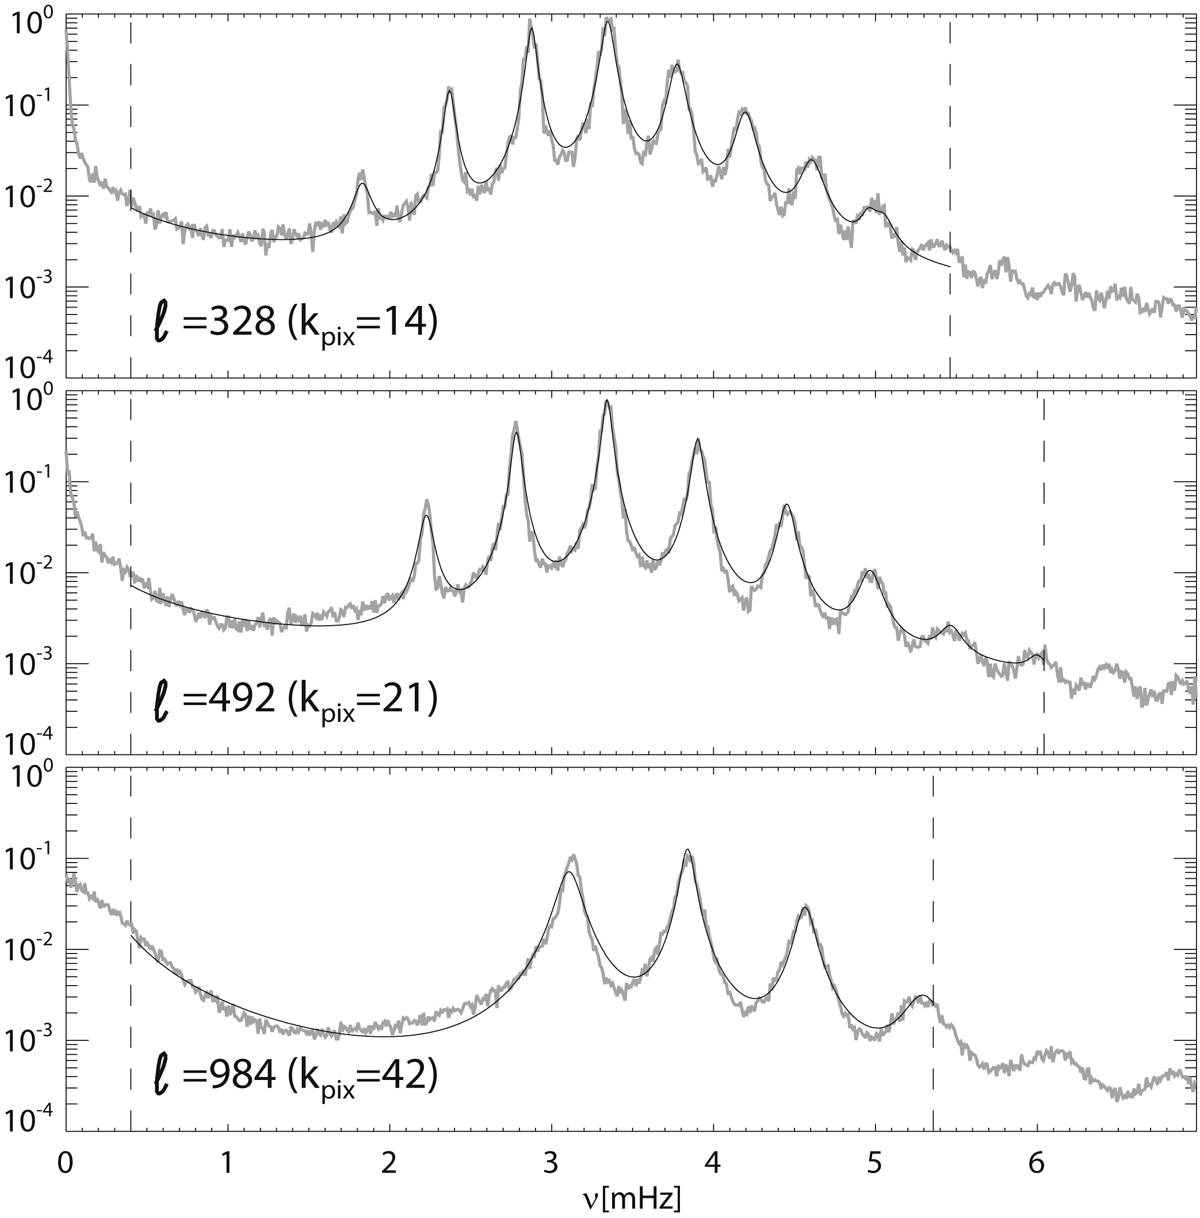
Slices through the input limit spectrum (black) and observational spectrum averaged over one Carrington rotation (gray), which was used to obtain the input parameters, at θ = 0 and a few different values of k. Vertical dashed lines indicate the fitting ranges and the models are plotted only within these ranges. Lower limits for all k are fixed at 0.4 mHz, while the upper limits depend on the initial guess for each k, and they are the highest peak frequencies plus the widths of the peak. For the cases of ℓ = 328 and 492 (kpix = 14 and 21, respectively), the peaks with the radial order, n, from 0 to 7 are used in the fitting, while for the case of ℓ = 984 (kpix = 42), 0 ≤ n ≤ 3.
Current usage metrics show cumulative count of Article Views (full-text article views including HTML views, PDF and ePub downloads, according to the available data) and Abstracts Views on Vision4Press platform.
Data correspond to usage on the plateform after 2015. The current usage metrics is available 48-96 hours after online publication and is updated daily on week days.
Initial download of the metrics may take a while.