Fig. 4
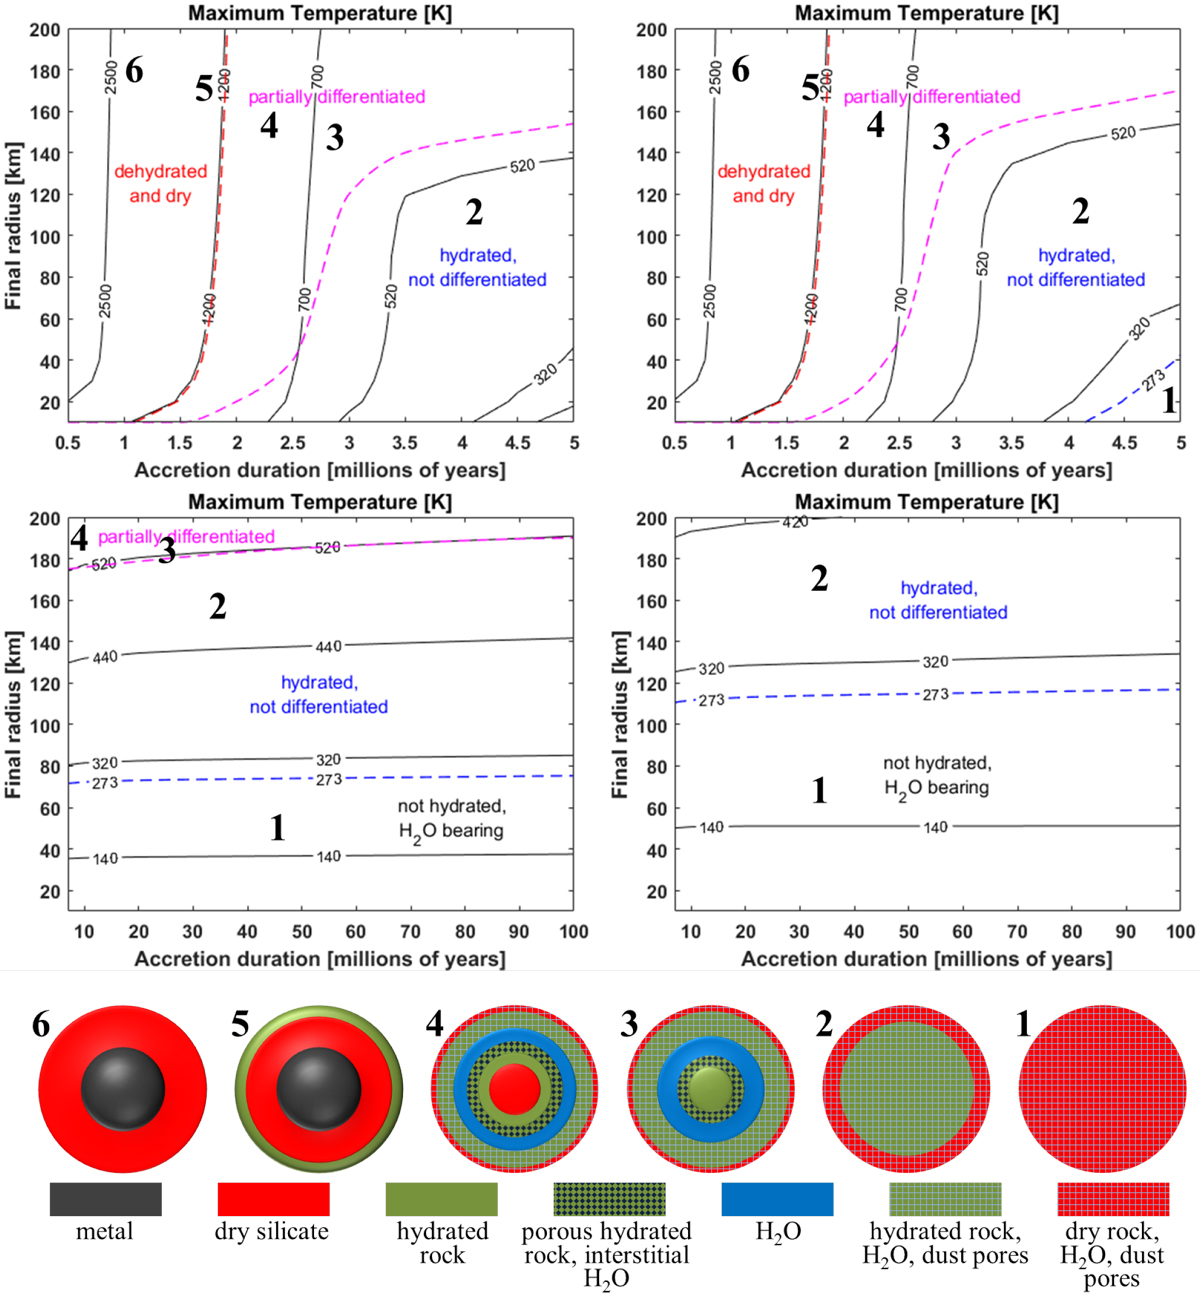
Maximum central temperature Tc,max for 10 km ≤ R ≤ 200 km, t0 = 0 Myr and tac varying according to the accretion scenarios from Table 4. Upper left panel: asteroid belt, dust/ice = 3∕1. Middle left panel: inter-planet disk, dust/ice = 3∕1. Upper right panel: Kuiper belt, dust/ice = 3∕1. Middle right panel: Kuiper belt, dust/ice = 1∕1. Lower panel:final structures of initially icy planetesimals, numbered 1 through 6 according to the degree of differentiation. Not all of the structures are obtained for the accretion at different heliocentric distances (see Table 5 for an overview). Hydration of silicates is indicated by the dashed blue lines, starting at the water ice melting temperature of 273 K (serpentinization at 273 K takes ≈200 days according to Wakita & Sekiya (2011) and Jones & Brearley (2006); the temperature interval of 320− 520 K has been suggested by Allen & Seyfried 2004). We note that consideration of endothermic processes, such as melting of metal and silicates, could reduce the temperature and shift the isolines with T > 1260 K slightly to earlier accretion times and larger radii.
Current usage metrics show cumulative count of Article Views (full-text article views including HTML views, PDF and ePub downloads, according to the available data) and Abstracts Views on Vision4Press platform.
Data correspond to usage on the plateform after 2015. The current usage metrics is available 48-96 hours after online publication and is updated daily on week days.
Initial download of the metrics may take a while.