Fig. 9
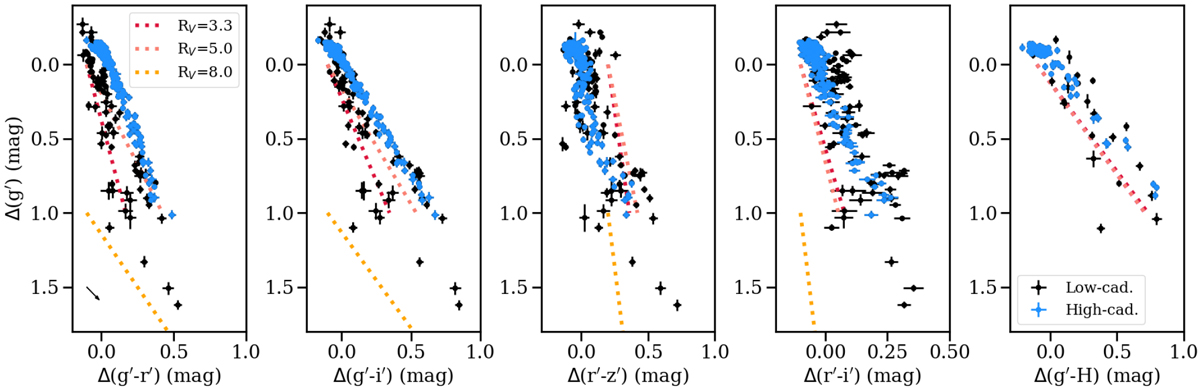
Relative color-magnitude variations in optical and H-band REM data. Dotted lines indicate the extinction vector for several extinction laws (RV = 3.3, 5.0 and 8.0, derived following Schlegel et al. 1998). High-cadence data are plotted in blue, while remaining data are shown in black. All magnitudes are relative to the median value in each filter. Black arrow on the left of the first panel shows the correlation direction for cases where g′ is also used to calculate the color, showing 3× the average uncertainty.
Current usage metrics show cumulative count of Article Views (full-text article views including HTML views, PDF and ePub downloads, according to the available data) and Abstracts Views on Vision4Press platform.
Data correspond to usage on the plateform after 2015. The current usage metrics is available 48-96 hours after online publication and is updated daily on week days.
Initial download of the metrics may take a while.