Fig. 7
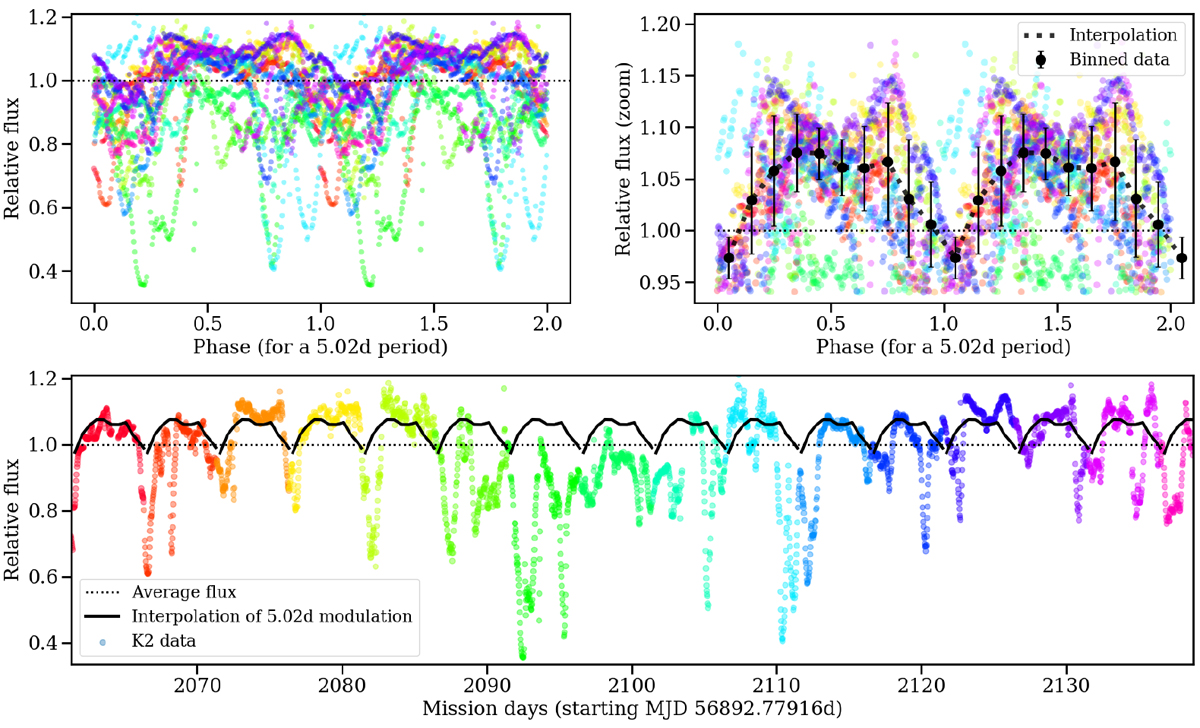
K2 data wrapped according to a period of 5.015 d. Data are color-coded according to date to better display points thatwere taken close in time. Upper left panel: entire K2 data wrapped, showing the phase twice to aid the eye. Upper right panel: zoom in on the “out-of-eclipse” part of the K2 data (colored points, selected via σ-clipping), together with the average and standard deviation in 10 intervals in phase space (black points; the errorbars correspond to the standard deviation within each bin) and an interpolation curve to trace the shape of the variations. Bottom panel: full K2 data plotted against mission day, together with interpolated modulation curve of top-right panel, to show how the phase of the eclipses drifts at certain times during the observation campaign, although 5 d periodicity remains visible throughout the full dataset.
Current usage metrics show cumulative count of Article Views (full-text article views including HTML views, PDF and ePub downloads, according to the available data) and Abstracts Views on Vision4Press platform.
Data correspond to usage on the plateform after 2015. The current usage metrics is available 48-96 hours after online publication and is updated daily on week days.
Initial download of the metrics may take a while.