Fig. 6
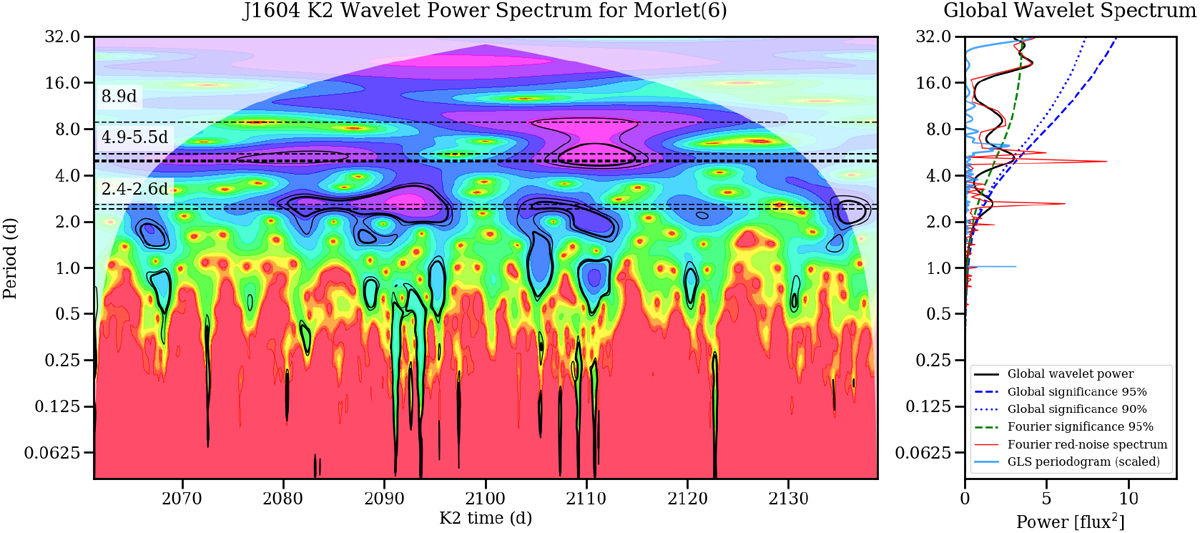
Wavelet power spectrum for K2 data on RX J1604.3-2130. Left panel: wavelet spectrum in time. Color scale is set between minimum and maximum power, and global significance limits are marked as thick black (95% confidence) and thin black (90% confidence) contours, calculated for a red noise data model with α = 0.98. Regions where edge effects could be significant are masked out. Horizontal lines mark positions of the GLSP peaks found with K2 and REM (at 8.9 d, 5.5 d, 5.0 d, 4.9 d, 2.59 d, 2.39 d). Right panel: global wavelet power together with the significance, the noise spectrum, and the scaled GLSP for comparison.
Current usage metrics show cumulative count of Article Views (full-text article views including HTML views, PDF and ePub downloads, according to the available data) and Abstracts Views on Vision4Press platform.
Data correspond to usage on the plateform after 2015. The current usage metrics is available 48-96 hours after online publication and is updated daily on week days.
Initial download of the metrics may take a while.