Fig. 5
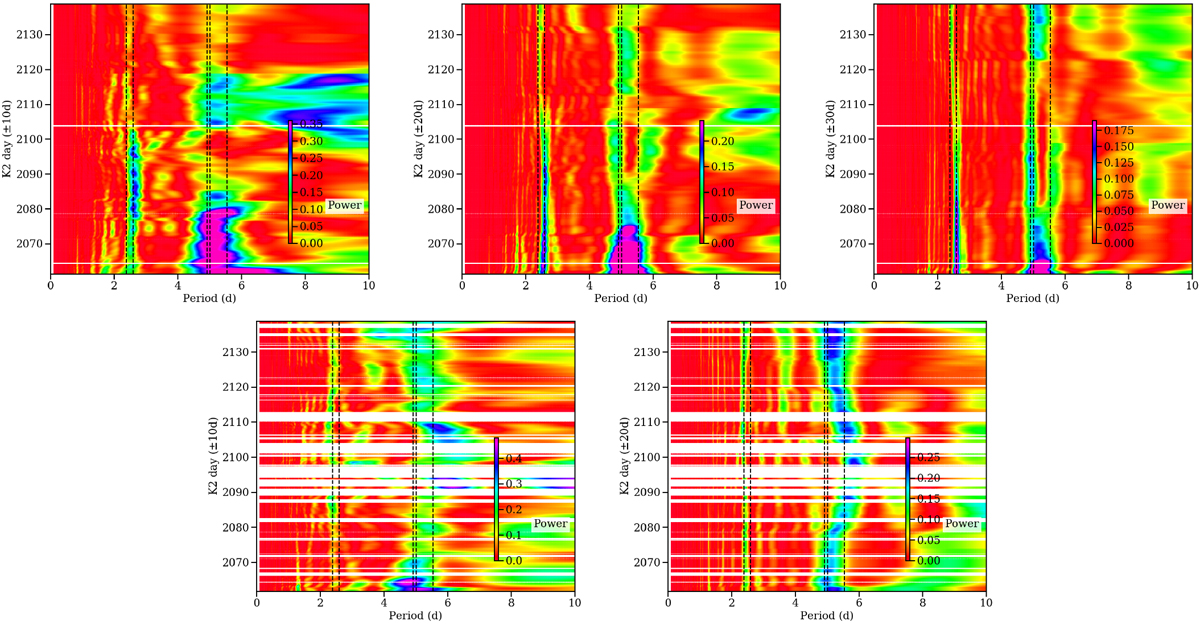
Stacked GLSP for full K2 data (top three panels, stacking at intervals of ± 10 d, ± 20 d, ± 30 d) and σ-clipped data (out-of-eclipse data; bottom two panels, stacking at intervals of ±10 d and ± 20 d). The most significant periods detected in the individual GLSP are marked with vertical lines (see text for discussion). In each panel, x-axis shows periods, and y-axis shows date (in K2 mission days) around which we consider the time interval to estimate the SGLSP. Dates for which no data are available are left blank. Color scale is set so that purple is equivalent to 95% significance and dark blue is equivalent to 90% significance for a red noise model with the same number of points, similarly distributed (see text).
Current usage metrics show cumulative count of Article Views (full-text article views including HTML views, PDF and ePub downloads, according to the available data) and Abstracts Views on Vision4Press platform.
Data correspond to usage on the plateform after 2015. The current usage metrics is available 48-96 hours after online publication and is updated daily on week days.
Initial download of the metrics may take a while.