Fig. 4
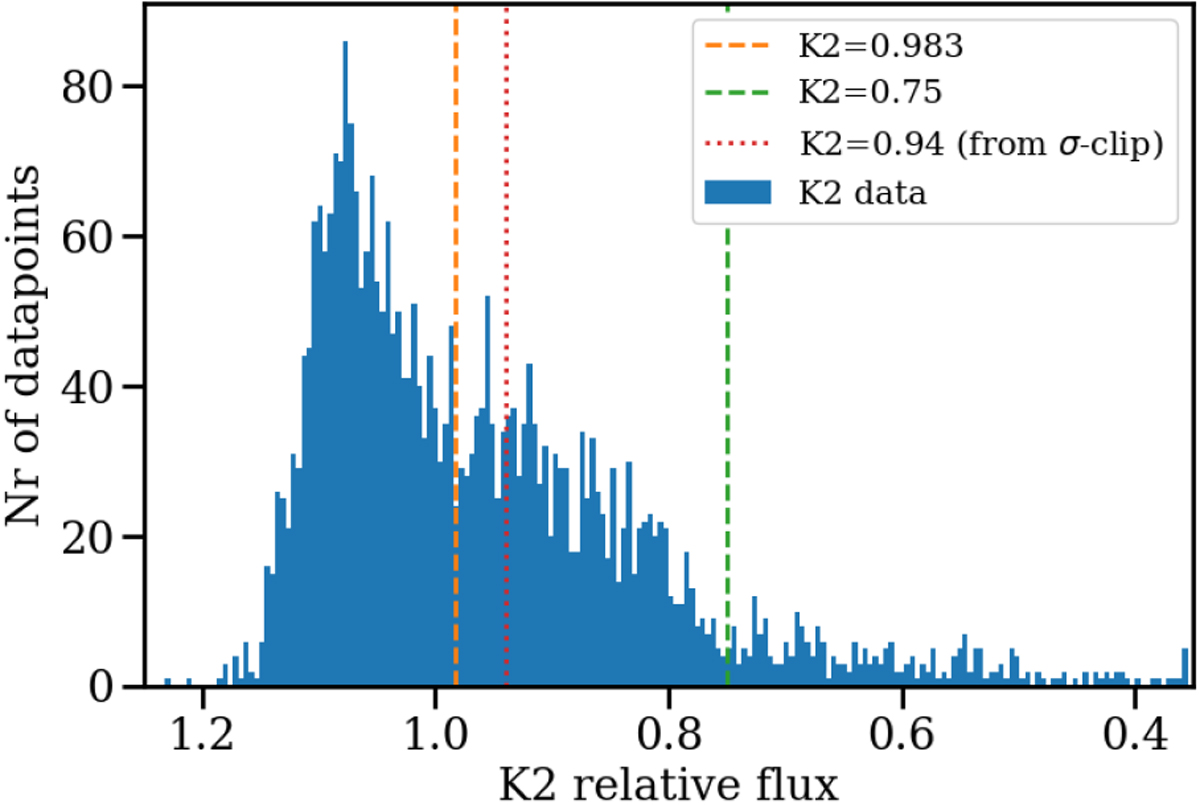
Histogram of K2 data by magnitude. Note that there is no clear separation between “on-eclipse” and “off-eclipse” parts, except in very deep eclipses (relative flux <0.75, green line). The red dotted line marks the separation from the σ-clipping filter. Selecting down to a different level (e.g., 0.983, orange line, where the distribution appears to slightly flatten out) does not introduce any significant change.
Current usage metrics show cumulative count of Article Views (full-text article views including HTML views, PDF and ePub downloads, according to the available data) and Abstracts Views on Vision4Press platform.
Data correspond to usage on the plateform after 2015. The current usage metrics is available 48-96 hours after online publication and is updated daily on week days.
Initial download of the metrics may take a while.