Fig. 2
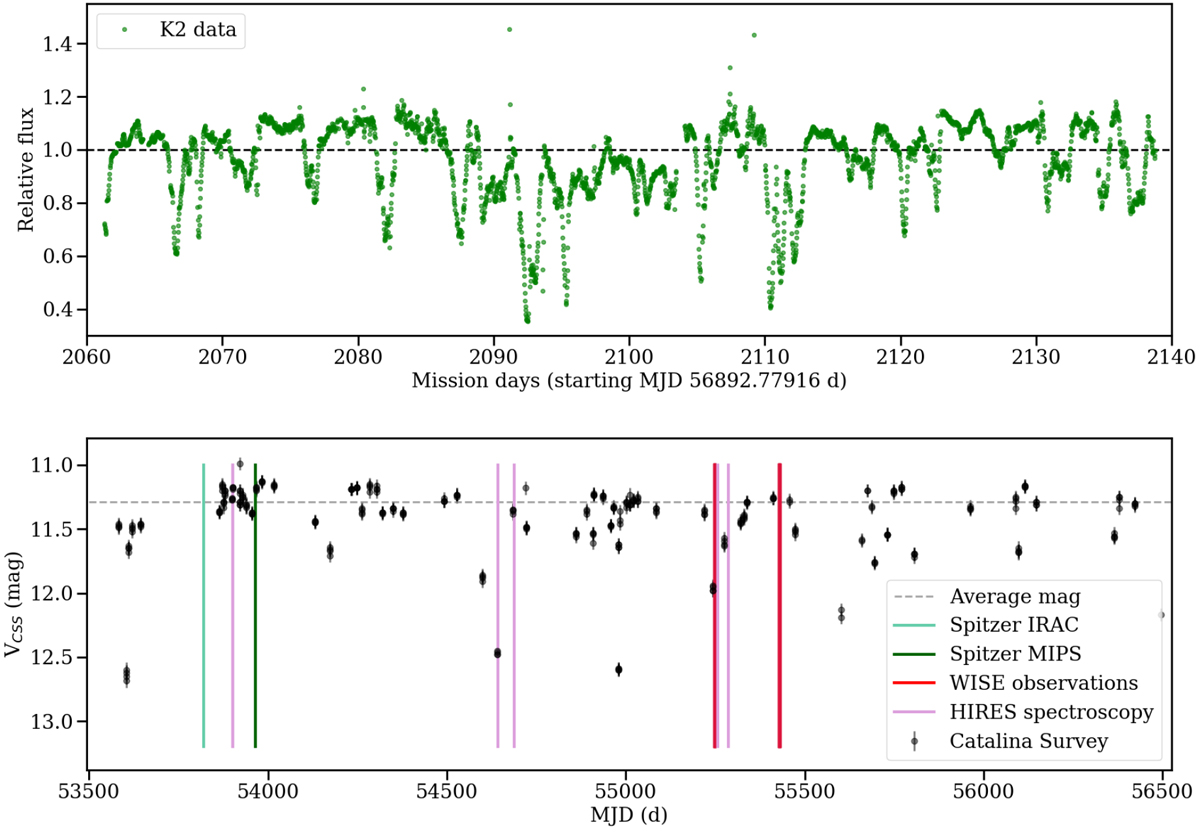
Top: K2 lightcurve for RX J1604.3-2130. Typical uncertainties are smaller than dots. Bottom: Catalina Survey DR2 lightcurve. Since Catalina data cover the epochs of the Spitzer, WISE, and HIRES spectroscopy observations, we have marked them in the figure as vertical lines (see text). In both cases, the average flux (magnitude) is shown as a dotted line.
Current usage metrics show cumulative count of Article Views (full-text article views including HTML views, PDF and ePub downloads, according to the available data) and Abstracts Views on Vision4Press platform.
Data correspond to usage on the plateform after 2015. The current usage metrics is available 48-96 hours after online publication and is updated daily on week days.
Initial download of the metrics may take a while.