| Issue |
A&A
Volume 633, January 2020
|
|
|---|---|---|
| Article Number | A75 | |
| Number of page(s) | 9 | |
| Section | Extragalactic astronomy | |
| DOI | https://doi.org/10.1051/0004-6361/201936504 | |
| Published online | 13 January 2020 | |
Slowly rotating Bose–Einstein condensate compared with the rotation curves of 12 dwarf galaxies
1
Department of Experimental Physics, University of Szeged, Dóm tér 9, 6720 Szeged, Hungary
2
Konkoly Observatory, Research Center for Astronomy and Earth Sciences, Konkoly Thege Miklós út 15-17, 1121 Budapest, Hungary
e-mail: This email address is being protected from spambots. You need JavaScript enabled to view it.
3
Department of Theoretical Physics, University of Szeged, Tisza Lajos krt 84-86, 6720 Szeged, Hungary
e-mail: This email address is being protected from spambots. You need JavaScript enabled to view it.
4
Institute of Physics, University of Szeged, Dóm tér 9, 6720 Szeged, Hungary
e-mail: This email address is being protected from spambots. You need JavaScript enabled to view it.
Received:
13
August
2019
Accepted:
7
November
2019
Abstract
Context. The high plateaus of the rotation curves of spiral galaxies suggest either that there is a dark component or that the Newtonian gravity requires modifications on galactic scales to explain the observations. We assemble a database of 12 dwarf galaxies, for which optical (R-band) and near-infrared (3.6 μm) surface brightness density together with spectroscopic rotation curve data are available, in order to test the slowly rotating Bose–Einstein condensate (BEC) dark matter model.
Aims. We aim to establish the angular velocity range compatible with observations, bounded from above by the requirement of finite-size halos, to check the model fits with the dataset, and the universality of the BEC halo parameter ℛ.
Methods. We constructed the spatial luminosity density of the stellar component of the dwarf galaxies based on their 3.6 μm and R-band surface brightness profiles, assuming an axisymmetric baryonic mass distribution with arbitrary axis ratio. We built up the gaseous component of the mass by employing an inside-truncated disk model. We fitted a baryonic plus dark matter combined model, parametrized by the M/L ratios of the baryonic components and parameters of the slowly rotating BEC (the central density ρc, size of the BEC halo ℛ in the static limit, angular velocity ω) to the rotation curve data.
Results. The 3.6 μm surface brightness of six galaxies indicates the presence of a bulge and a disk component. The shape of the 3.6 μm and R-band spatial mass density profiles being similar is consistent with the stellar mass of the galaxies emerging wavelength-independent. The slowly rotating BEC model fits the rotation curve of 11 galaxies out of 12 within the 1σ significance level, with the average of ℛ as 7.51 kpc and standard deviation of 2.96 kpc. This represents an improvement over the static BEC model fits, also discussed. For the 11 best-fitting galaxies the angular velocities allowing for a finite-size slowly rotating BEC halo are less then 2.2 × 10⁻¹⁶ s−1.For a scattering length of the BEC particle of a ≈ 106 fm, as allowed by terrestrial laboratory experiments, the mass of the BEC particle is slightly better constrained than in the static case as m ∈ [1.26 × 10⁻¹⁷ ÷ 3.08 × 10⁻¹⁷] (eV c−2).
Key words: galaxies: dwarf / galaxies: structure / dark matter / galaxies: halos
© ESO 2020
1. Introduction
The pioneering work by Vera Rubin and her collaborators on optical (Hα) galaxy rotation curves proved the presence of an unknown form of matter (Rubin et al. 1978, 1985). It was followed up by the radio (HI) observations, first systematically conducted by Albert Bosma (e.g., Bosma et al. 1977; Bosma 1981). Fritz Zwicky also concluded from the dynamic analysis of galaxy clusters the existence of some invisible material (Zwicky 1937), referred to as dark matter (DM).
Since then other evidence has appeared for matter interacting only gravitationally, such as gravitational lensing (e.g., Wegg et al. 2016; Chudaykin et al. 2016), or measurements on the cosmic microwave background radiation (Planck Collaboration VIII 2016). Recent observations with the Planck satellite indicate that DM makes up about one-quarter of the energy of the Universe (Planck Collaboration VIII 2016; Planck Collaboration VI 2018).
Galactic astronomy cannot explain the observed rotation curves through luminous matter alone. Several DM-type mass density profiles were proposed to relax the problem of the missing mass. The Navarro–Frenk–White (NFW) DM model (Navarro et al. 1996) emerged from cold DM structure-formation simulations. The pseudo-isothermal halo model (Gunn & Gott 1972) has a core-like constant density profile avoiding the density singularity of the NFW model emerging at the center of the galaxies.
Supplementing other viable proposals, Böhmer & Harko (2007) considered the possibility that DM could be in the form of a Bose–Einstein condensate (BEC). They described DM as a nonrelativistic, Newtonian gravitational BEC gas, obeying the Gross–Pitaevskii equation with density and pressure related through a barotropic equation of state. They fitted the Newtonian tangential velocity of the model with a sample of rotation curves of low surface brightness and dwarf galaxies, finding good agreement.
Dwornik et al. (2015) tested the BEC DM model against rotation curve data of high and low surface brightness galaxies. Fits were of similar quality for the BEC and NFW DM models, except for the rotation curves exhibiting long flat regions, slightly favoring the NFW profiles.
Kun et al. (2018) compared a nonrelativistic BEC model of light bosons interacting gravitationally either through a Newtonian or a Yukawa-potential with the observed rotational curves of 12 dwarf galaxies. The rotational curves of five galaxies were reproduced with a high confidence level by the BEC model. Allowing for a low mass the gravitons resulted in similar performances of the fit. The upper mass limit for the graviton in this approach resulted in 10−26 eV c−2.
Zhang et al. (2018) derived the tangential velocity of a test particle moving in a slowly rotating Bose–Einstein condensate (srBEC)-type DM halo. In this paper we compare their model with the rotation curve of 12 dwarf galaxies. The rotational velocity is parametrized by the central density of the srBEC halo (ρc), the radius of the static BEC halo (ℛ), and the angular velocity (ω) of the srBEC halo. The value of ℛ is determined by the scattering length a and the mass m of the DM particle. Therefore, ℛ is expected to be a universal constant and the different size of the srBEC halos should emerge due to the differences in their angular velocity.
In Sect. 2 we give the contribution of the baryonic component to the galaxy rotation curves. We present the model of the stellar component, we argue for a more sophisticated stellar model producing better results than the widely accepted exponential disk model, and we build up the 3.6 μm and R-band spatial luminosity density models to compare them to each other. At the end of this section we present the model of the gaseous component. In Sect. 3 we introduce the srBEC model. We address the maximum rotation of the srBEC halos, a novel concept advanced in relation with this model. In Sect. 4 we present and discuss the best-fit rotation curve models of 12 dwarf galaxies. In Sect. 5 we summarize our results and give final remarks.
2. Baryonic model
2.1. Stellar component
The stellar contribution to rotational curves is derived based on the distribution of the luminous matter, deduced from the surface brightness of the galaxies. We follow Tempel & Tenjes (2006) to derive the surface brightness density model, assuming the spatial luminosity density distribution of each visible component given by
![Mathematical equation: $$ \begin{aligned} l(a)=l(0)\exp \left[ -\left( \frac{a}{ka_\mathrm{0} }\right)^{{1/N}} \right]. \end{aligned} $$](/articles/aa/full_html/2020/01/aa36504-19/aa36504-19-eq1.gif) (1)
(1)
Here  is the central density, where a0 characterizes the harmonic mean radius of the respective component, and k and h are scaling parameters. Furthermore,
  , where q is the axis ratio, and r and z are cylindrical coordinates. This model does not take into account the possible intrinsic absorption of galaxies. From the measurements the projection of l(a) onto the plane of the sky perpendicular to the line of sight, the surface luminosity is
 (2)
(2)
where A is the major semi-axis of the equidensity ellipse of the projected light distribution and Q2 = cos2ι + q2sin2ι is the projected axial ratio. Here S(A) arises as a sum for n visible components. We employed inclination-corrected surface density profiles (see the galaxy inclinations in Lelli et al. 2016, and references therein), and then the surface luminosity is as in Kun et al. (2017), where R is the galactocentric radius:
 (3)
(3)
We note that fitting surface brightness distributions of galaxies might be risky in some cases, for example if a galaxy is seen edge-on (or nearly) and has a significant bulge. Equation (3) was fitted to the de-projected surface luminosity profiles, assuming a constant axis ratio q. In the two-component stellar model the spatial mass density is
 (4)
(4)
where lb(a) and ld(a) are the spatial luminosity densities of the bulge and disk components, and Υb and Υd are the respective mass-to-light ratios (M/L) given in solar units.
It follows from the Poisson equation that for spheroidal shape matter, the rotational velocity squared in the galactic plane (z = 0) induced by each stellar component is given by Tamm & Tenjes (2005)
 (5)
(5)
where i = b, d, G is the gravitational constant,  is the eccentricity of the ith stellar component, and ρi(r) is its mass density.
2.2. Exponential disk and Tempel–Tenjes models
The SPARC database (Lelli et al. 2016) offers robust mass models of a sample of 175 disk galaxies with Spitzer 3.6 μm photometry together with accurate rotation curves, well-suited to test rotation curve models. The largest number of dwarf galaxies were assumed to be bulgeless, and their photometry was fitted by an exponential disk model. The disk model is a widely explored in automatized modeling. We selected 12 galaxies from this database, with the longest near-infrared (NIR) surface photometry profiles and accurate rotation curves, for which R-band counterparts are also available (see next subsection for details of the motivation).
Unfortunately, the exponential disk model in SPARC sometimes underestimates the luminosity of the inner region; in other cases it under- or overestimates the outer region (see Fig. 1). Therefore, we explored a more sophisticated Tempel–Tenjes model; moreover, for half of the galaxies we considered both bulge and disk, as indicated by their photometric data. We binned the NIR surface brightness profile of the galaxies on a logarithmic scale to smooth out any possible small-scale inhomogeneities. The best-fit baryonic parameters are presented in Table 1; the respective galaxy names have the superscript NIR. In Fig. 1 we show the best-fit Tempel–Tenjes models for the chosen galaxies, along with their exponential disk fit from the SPARC. It is clear that the Tempel–Tenjes model has a better fit to the surface brightness data.
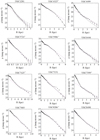 |
Fig. 1. Exponential disk model (purple dashed line) from the SPARC database and Tempel–Tenjes disk model in the present paper, or bulge+disk model (black continuous line) of the 12 dwarf galaxies. The 3.6 μm SPARC surface brightness data are presented as black dots with error bars. The superscript star (⋆) indicates galaxies with a two-component stellar model (bulge+disk). |
Best-fit parameters describing the luminosity density distribution of the baryonic matter of dwarf galaxies at 3.6 μm (indicated by the superscript NIR) and optical wavelengths (indicated by the superscript R).
2.3. Near-infrared and R-band spatial luminosity models
We took the R-band (effective central wavelength 634.9 nm, FWHM 106.56 nm) surface brightness data of the same 12 late-type dwarf galaxies from the Westerbork HI survey of spiral and irregular galaxies to build up their R-band photometric models (Swaters 1999; Swaters & Balcells 2002; Swaters et al. 2009). These measurements were made with the 2.54 m Isaac Newton Telescope on La Palma in the Canary Islands. We again fitted the data with the Tempel–Tenjes model. Galaxies described by a two-component surface brightness model (bulge+disk) at 3.6 μm are described by a two-component model in the R band as well. For the absolute R-magnitude of the Sun ℳ⊙, R = 4.42m (Binney & Merrifield 1998) was adopted. The best-fit parameters describing the R-band spatial luminosity density of these 12 dwarf galaxies are given in Table 1 (the galaxy names with the superscript R). Compared to the 3.6 μm data, the R-band data result in lower luminosities for almost all of the galaxies; one exception is the galaxy UGC 6446.
Earlier studies indicate that the NIR M/L value depends weakly on the color for both the bulge and the disk; several models predict its constancy in the NIR over a broad range of galaxy masses and morphologies (e.g., McGaugh & Schombert 2014, and references therein). The NIR surface photometry provides the most sensitive proxy to the stellar mass, as shown by Verheijen (2001), among others. We built the spatial mass density distribution of the disk (and bulge) employing the NIR and R-band surface brightness models, and Eq. (4).
The total mass of the stellar component should not depend on the wavelength at which the galaxies are observed. The masses of the bulge and the disk should be the same for the 3.6 μm and R-band measurements,
 (6)
(6)
 (7)
(7)
where Υ is the M/L ratio, L is the total luminosity, and M is the total mass. We give the total luminosities in Table 1 based on the best-fit surface brightness models of the galaxies. Then the R-band M/L ratios are
 (8)
(8)
 (9)
(9)
for the bulge and disk, respectively. The values for σ and τ are given in Table 2, calculated based on the R to NIR ratio of the total luminosities of the 12 galaxies of the sample.
Values of σ and τ for the 12 dwarf galaxies of the sample, which indicate how much larger the R-band M/L values of the bulge and disk are compared to those of the 3.6 μm M/L values.
In Fig. 2 we plot the mass densities of the 12 dwarf galaxies employing the best-fit surface brightness density models (from Table 1). Stellar population models and earlier studies on the conversion between the NIR flux and stellar mass suggest that the typical value of the stellar M/L in NIR should be at about 0.5 M⊙/L⊙ (e.g., Eskew et al. 2012; McGaugh & Schombert 2014, and references therein). We assume ΥNIR, d ≡ 0.5 to derive the mass density from the luminosity density, and for those galaxies with bulge ΥNIR, b ≡ 0.5, in order to calculate through Eq. (9) how much higher the M/L of the disk is (and of the bulge where it applies) than that of the NIR M/L values. In the case of the galaxies of the present sample σ (where it applies) and τ are given in Table 2. The predicted shape of the spatial mass densities is similar for the R and NIR bands.
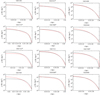 |
Fig. 2. Mass density models of the 12 galaxies at 3.6 μm (red line) and in R band (black line). The coordinate r is measured in the galactic plane (where a = r, because z = 0). The superscript star (⋆) indicates galaxies with a two-component stellar model (bulge+disk). |
The SPARC 3.6 μm photometry samples the surface brightness of the galaxies from a region five to ten times closer to the center of the galaxies, out of the same region where the R-band observations end. Due to their good resolution, and because they are the closest proxy to the stellar mass distribution, we employed the SPARC 3.6 μm data to model the stellar component of the baryonic mass of the galaxies (see next section) to test the slowly rotating BEC model.
2.4. Gaseous component
Observations of galaxies show that for a large fraction of dwarf galaxies the rotation velocity of the gas (measured by emission lines) is close to the rotation velocity of the stellar component (measured by absorption lines; e.g., Rhee et al. 2004). Therefore, for these galaxies it is necessary to involve a gaseous contribution to the baryonic component of their rotation curves. The rotation velocity square of an exponential disk (Binney & Tremaine 1987) is as follows:
![Mathematical equation: $$ \begin{aligned} { v}_\mathrm{gas} ^2(R)= 4 \pi G \Sigma _{0} R_\mathrm{d} { y}^2 \left[I_0({ y}) K_0({ y})-I_1({ y}) K_1({ y})\right], \end{aligned} $$](/articles/aa/full_html/2020/01/aa36504-19/aa36504-19-eq15.gif) (10)
(10)
where Σ0 is the central surface mass density, Rd is the scale length of the disk, y ≡ R/2Rd, and I and K are the modified Bessel functions. We applied a modified version of this equation by introducing the truncation radius Rt inside of which the gaseous component is negligible such that y ≡ (R − Rt)/2Rd. Then Σ0 is the central surface mass density at the truncation radius Rt.
To build up the contribution of the gaseous component to the baryonic rotation curves we fitted this truncated exponential disk model to the positive discrete values of the gas velocity given in the SPARC database (see the gas surface densities and gas velocities in Lelli et al. 2016, and references therein). Negative velocities might be related to gas with noncircular motion or reflect that the gas distribution has a significant central depression. The best-fit values of Σ0, Rd, and Rt are given in Table 3 along the total mass of the gaseous component, which is given by  .
.
Best-fit parameters of the rotational curve models of 12 dwarf galaxies.
3. Dark matter model
3.1. Slowly rotating BEC-type dark matter component
The slowly rotating BEC (srBEC) DM model (Zhang et al. 2018) has three free parameters: the central density ρc, the size of the BEC halo ℛ in the static limit, and the angular velocity ω. The radius of the static BEC DM halo ℛ is determined by the mass m and scattering length a of the DM particle through
 (11)
(11)
where ℏ is the reduced Planck-constant. Assuming that only one type of DM particle builds up the BEC halo (i.e., m and a are the same for all galaxies), ℛ should be a universal constant. For slowly rotating BEC halos (assumed to be in rigid rotation) the actual size of the halo depends on their central density (ρc) and angular speed (ω). Four parameters set up the srBEC halos: m and a are microscopic parameters related to the DM particle, ρc and ω are macroscopic parameters of the condensate. The equatorial radius of the srBEC DM halo is given by Zhang et al. (2018),
 (12)
(12)
where
 (13)
(13)
In the nonrotating case Ω = 0 and R0(π/2) = ℛ = π/k, the tangential velocity squared  of massive test particles rotating in the BEC galactic DM halo is given in the first order of approximation as in the equatorial plane of the galaxies by
![Mathematical equation: $$ \begin{aligned} { v}_\mathrm{srBEC} ^2(R)&=\frac{4G\rho _\mathrm{c} \mathcal{R} ^2}{\pi }\nonumber \\&\quad \times \Bigg [\left(1-\Omega ^2\right)\frac{\sin \left(\pi R/\mathcal{R} \right)}{\pi R/\mathcal{R} }-\left(1-\Omega ^2\right)\cos \frac{\pi R}{\mathcal{R} } +\frac{\Omega ^2}{3}\left(\frac{\pi R}{\mathcal{R} }\right)^2\Bigg ], \end{aligned} $$](/articles/aa/full_html/2020/01/aa36504-19/aa36504-19-eq26.gif) (14)
(14)
or equivalently1,
![Mathematical equation: $$ \begin{aligned} { v}_\mathrm{srBEC} ^2\left(\mathrm{km^2\,s^{-2}}\right)&= 80.861\times \left(\frac{\rho _\mathrm{c} }{10^{-24}\;\mathrm{g}\,\mathrm{cm}^{-3}}\right) \times \left(\frac{\mathcal{R} }{\mathrm{kpc}}\right)^2\nonumber \\&\quad \times \,\Bigg [\left(1-\Omega ^2\right)\left[\frac{\sin \left(\pi R/\mathcal{R} \right)}{\pi R/\mathcal{R} }-\cos \frac{\pi R}{\mathcal{R} }\right] +\frac{\Omega ^2}{3}\left(\frac{\pi R}{\mathcal{R} }\right)^2\Bigg ]. \end{aligned} $$](/articles/aa/full_html/2020/01/aa36504-19/aa36504-19-eq27.gif) (15)
(15)
3.2. Maximum rotation of the slowly rotating BEC halo
When formulating the srBEC model, Zhang et al. (2018) applied first-order corrections to the density and radius of the DM halo. In Fig. 3 we present the density profile of the srBEC halo as a function of the distance from the center of the galaxy measured in its equatorial plane and of the angular velocity of the DM halo, for three values of the central density ρc. With increasing BEC DM halo rotation, the density does not drop to zero; instead, it exhibits a positive density extending to infinity. For slower rotation, however, at some finite radius the density reaches zero, where the model should have a cutoff (otherwise it is continued through negative densities). The two regimes are separated by a limiting omega value, the fastest angular velocity allowing a finite srBEC halo (having zero density at a given radius). We consider the density profile realistic only when and until it first reaches the zero-level. The fastest rotation velocity ω of a realistic srBEC halo (which can have zero density at a given radius) depends on the central density ρc, a higher ρc resulting in higher limiting ω.
 |
Fig. 3. Density of the srBEC halo (colored surface) as a function of the distance measured from the rotation axis of the galaxy in its equatorial plane (R, on the x-axis), and of the angular velocity (ω, on the y-axis). The ρ = 0 level surface is also indicated. The following model parameters are used: size of the BEC halo in the static limit, ℛ = 10 kpc, and the central density of ρc = 1 × 10⁻²⁴ g cm−3 (left panel), ρc = 2 × 10⁻²⁴ g cm−3 (middle), and ρc = 3 × 10⁻²⁴ g cm−3 (right). |
In Fig. 4 we present again the density profile of the srBEC halo, varying this time the size ℛ of the static BEC halo. In the left panel we can see that for small angular velocity values the srBEC density reaches zero, after which a cutoff of the model has to be applied in order to have only positive densities. This procedure also ensures the finite size of the srBEC halo. The highest ω giving a finite-size halo does not seem to depend on the size of the static BEC halo ℛ, only on the central density ρc. While for small ω the trigonometric term in Eq. (15) dominates, for larger ω the monotonic r2 term is dominant. In this paper we consider only finite-size srBEC models, thus those possessing an upper limit for ω.
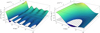 |
Fig. 4. Density profile of the srBEC model (colored surface), as a function of the distance measured from the rotation axis of the galaxy in its equatorial plane (R, on the x-axis), and of the angular velocity (ω, on the y-axis). For comparison we also indicate the ρ = 0 level. The model parameters are as follows: the central density, ρc = 1 × 10⁻²⁴ g cm−3, and the size of the BEC halo in static limit is ℛ = 4 kpc (left panel) and ℛ = 16 kpc (right panel). |
4. Rotation curve model of 12 dwarf galaxies
In the previous sections we give the contribution of the baryonic sector (Sect. 2) and the slowly rotating BEC-type DM halo (Sect. 3) to the combined rotation curve models. Then the model rotation curve in the equatorial pane of the galaxy is given as (Rodrigues et al. 2018)
 (16)
(16)
where vgas, vb, vd, and vsrBEC are respectively the contributions of the gaseous component, the bulge (where it applies), the disk, and the DM halo to the rotation curves.
When fitting Eq. (16) to the observed rotation curves, we apply a nonlinear least-squares method to perform the fit with error−2 weights, minimizing the residual sum of squares (χ2) between the data and the model. We are interested in models where the mass density of the halo drops to zero for a given radius; therefore, we set an upper limit for ω that allows only fits that result in finite-size halos (see Sect. 3.2). This limit is dynamically changing during the fit with ρc. The fitted parameters are Υb and Υd for the stellar component, and ρc, ℛ, and ω for the srBEC component. Fitting M/L we are able to reveal the maximum performance of the srBEC model.
The parameters of the best-fit galactic rotation curves, composed of a baryonic and a srBEC-type DM component, are presented in Table 3, and the best-fit rotation curves are shown in Fig. 5 along with the observed curves. The combined model fits the dataset within the 1σ confidence level for 11 dwarf galaxies out of 12.
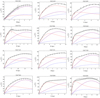 |
Fig. 5. Best-fit rotational curves of the dwarf galaxy sample. The dots with error-bars denote the observed rotational velocity curves. The fitted model, composed by a baryonic and a srBEC component is represented by the black curve. The red short-dashed curve draws the contribution of the stellar component, the blue tiny-dashed curve shows the contribution of the gas, and the long-dashed purple curve denotes the contribution of the srBEC-type DM halo to the rotation curve–models. |
The size of the static BEC halo ℛ is expected to be uniform for all of the galaxies, as it only depends on the mass and scattering length of the particle forming the BEC halo. From our fitting-procedure the average value of ℛ emerged as 7.51 kpc, with standard deviation 2.96 kpc (see Table 3).
We note that the rotational curve of two of the galaxies in our sample, UGC 7151 and UGC 8286, were already fitted by Zhang et al. (2018). The resulting BEC parameters from our fitting process are ρc = 0.75(3.2)×10−24 g cm−3, ℛ = 6.13(2.9) kpc, ω = 2.053(3.3)×10−161/s for UGC 7151 and ρc = 0.4(0.7)×10−24 g cm−3, ℛ = 11.54(7.0) kpc, ω = 0.06(3.0)×10−161/s for UGC 8286, where the best-fit parameters by Zhang et al. (2018) can be found in brackets. Differences arise for two main reasons. First, we employed a more detailed baryonic model. Second, in our work ω was limited to result in finite-size srBEC halos, as we described in Sect. 3.2. As a result the rotation curve consists of a shallow rising branch and a steeper decreasing branch. If ω is not limited, the rotation curve due to the srBEC would be periodic (e.g., UGC 7151 in Fig. 6 in Zhang et al. 2018), while ρ(R) does not drop to zero.
In Sect. 2.3 we derive the stellar mass density from the NIR luminosity density of the galaxies assuming M/L equal to 0.5 in order to calculate how much higher the R-band M/L values are compared to the NIR values, and to plot the NIR and R-band mass density curves (the total mass of the stellar component should not depend on the observational band). By fitting M/L (together with the srBEC parameters) to the rotational curve data we obtained different M/L values. Hence these galaxies may hold diverse stellar populations resulting in different luminosity characteristics (e.g., Bell & de Jong 2001; Bell et al. 2003).
5. Summary and final remarks
In this paper we assembled photometric data and rotation curves of 12 late-type dwarf galaxies in order to test the srBEC DM model from the SPARC database (3.6 μm photometry) and the Westerbork HI survey of spiral and irregular galaxies (R-band photometry). We had three particular interests: (1) establishing the limiting angular velocity below which the model leads to finite-size halos, (2) determining how well the model fits the dataset, and (3) understanding whether one of its parameters, the size of the BEC halo ℛ in the static limit, is really universal.
We investigated whether the widely employed exponential disk model accurately describes the surface brightness of the galaxies, and found it necessary to employ a more complicated model than the exponential one to correctly estimate the luminosity of the inner region of these galaxies. We built up the 3.6 μm and R-band spatial luminosity densities of the galaxies fitting the Tempel–Tenjes model to their surface brightness densities. For six galaxies a two-component model (bulge+disk) described their surface brightness density more accurately then the disk model. We found that the NIR luminosity of almost all galaxies was higher than the R-band value, leading to higher M/L ratios in R-band in order to generate the same stellar mass. We added a gaseous component by fitting a truncated exponential disk to the gas velocity given in the SPARC database.
The stellar component plus gas plus slowly rotating BEC combined rotation curve model fits the dataset within the 1σ confidence level in the case of 11 dwarf galaxies out of 12. The size of the static BEC halo ℛ, related to the BEC particle characteristics, hence expected to be the same for all galaxies, has an average value of  kpc, with standard deviation as 2.96 kpc (see Table 3). The best-fit limiting angular velocity which allows for a finite-size slowly rotating BEC halo is < 2.2 × 10⁻¹⁶ s−1 for the well-fitting 11 galaxies. Its average value is 1.32 × 10⁻¹⁶ s−1, with standard deviation 0.66 × 10⁻¹⁶ s−1. Based on the total masses (Table 3) the slowly rotating BEC-type DM dominates the rotation curves of 9 galaxies out of 12; the exceptions are UGC 4325, UGC 6446, UGC 7125.
The mass m of the BEC particle depends on its scattering length a and the size of the static BEC halo ℛ (Böhmer & Harko 2007):
![Mathematical equation: $$ \begin{aligned} m=6.73\times 10^{-2} [a\mathrm{(fm)} ]^{1/3} [\mathcal{R} \mathrm{(kpc)} ]^{-2/3}\,\mathrm{eV} . \end{aligned} $$](/articles/aa/full_html/2020/01/aa36504-19/aa36504-19-eq30.gif) (17)
(17)
Terrestrial laboratory experiments render the value of a to be ≈106 fm (e.g., Böhmer & Harko 2007). Hence, the mass of the BEC particle falls in the range m ∈ [1.26 × 10⁻¹⁷ ÷ 3.08 × 10⁻¹⁷] (eV c−2) based on the best fits of the srBEC model to the rotation curves of the present galaxy sample. The lower limit is given by galaxy UGC 7125 having the largest static BEC halo (ℛ = 14.381 kpc), and the upper limit from UGC 7603 having the smallest one (ℛ = 3.793 kpc). It is worth noting that UGC 7125 also has the smallest (ρc = 0.105 × 10⁻²⁴ g cm−3), while UGC 7603 the largest central density (ρc = 2.692 × 10⁻²⁴ g cm−3) among these galaxies. A slightly different lower limit on m emerges when assuming a static BEC model, the mass of the BEC particle falling in the range m ∈ [1.21 × 10⁻¹⁷ ÷ 3.08 × 10⁻¹⁷] (eV c−2). Again, the two limits are constrained by the galaxies UGC 7125 (from below, ℛ′ = 15.36 kpc) and UGC 7603 (from above, ℛ′ = 3.794 kpc). We also note that UGC 7125 possesses the longest rotation curve in the sample and UGC 7603 the shortest, hence the size of the static BEC halo seems to correlate with the length of the rotation curves.
Finally, we discuss whether the slow rotation improves the fits. By setting ω = 0 we fit a static BEC model to the rotational curve data, obtaining best-fit parameters given in Table 4. Comparison shows that the finite-size srBEC model gave slightly better fits, which are below 1σ in 11 cases, compared to only 10 cases for the static BEC halo fits. In the static case the average value of ℛ′ emerged as 8.42 kpc, with a standard deviation of 3.35 kpc, compared to the rotating BEC case with average of 7.51 kpc and standard deviation of 2.96 kpc. In a srBEC dark matter halo the tangential velocity of a test particle is higher than in the static case at the same position (Zhang et al. 2018), and the plateau of the rotation curves is slightly lifted. With ω = 0 the fitting process favors larger ℛ′ values to lift the plateau to give the same performance. This is why the average value of ℛ′ is larger than that of ℛ.
Best-fit parameters of the rotational curve models of 12 dwarf galaxies, composed of baryonic matter and a nonrotating BEC component.
According to our rotation curve analysis, the srBEC halo with suitable constrained angular velocity values proves to be a viable DM model. However, the steep decrease in either the static or the slowly rotating BEC rotation curves raises doubts about whether such a halo could be well fitted with galaxy lensing data.
This equation corrects Eq. (103) in Zhang et al. (2018). When they substituted the definition of Ω2 from their Eqs. (52)–(103), they missed the term (ρc/10−24 g cm−3)−1 from the right-hand side of their Eq. (52) due to a misprint. We thank T. Harko for pointing this out to us.
Acknowledgments
We thank the helpful comments and suggestions of the anonymous referee. We thank Tiberiu Harko and Maria Crăciun for suggesting to add the gas component to the baryonic sector. The authors acknowledge the support of the Hungarian National Research, Development and Innovation Office (NKFIH) in the form of the grant 123996. E. K. was supported by the Premium Post-doctoral Research Program of the Hungarian Academy of Sciences. The work of Z. K. was supported by the János Bolyai Research Scholarship of the Hungarian Academy of Sciences and by the UNKP-18-4 New National Excellence Program of the Ministry of Human Capacities.
References
- Bell, E. F., & de Jong, R. S. 2001, ApJ, 550, 212 [NASA ADS] [CrossRef] [Google Scholar]
- Bell, E. F., McIntosh, D. H., Katz, N., & Weinberg, M. D. 2003, ApJS, 149, 289 [NASA ADS] [CrossRef] [Google Scholar]
- Binney, J., & Merrifield, M. 1998, Galactic Astronomy (Princeton: Princeton University Press) [Google Scholar]
- Binney, J., & Tremaine, S. 1987, Galactic Dynamics (Princeton: Princeton University Press) [Google Scholar]
- Böhmer, C. G., & Harko, T. 2007, JCAP, 6, 025 [NASA ADS] [CrossRef] [Google Scholar]
- Bosma, A. 1981, AJ, 86, 1791 [NASA ADS] [CrossRef] [Google Scholar]
- Bosma, A., van der Hulst, J. M., & Sullivan, III., W. T. 1977, A&A, 57, 373 [NASA ADS] [Google Scholar]
- Chudaykin, A., Gorbunov, D., & Tkachev, I. 2016, Phys. Rev. D, 94, 023528 [NASA ADS] [CrossRef] [Google Scholar]
- Dwornik, M., Keresztes, Z., & Gergely, L. Á. 2015, in Thirteenth Marcel Grossmann Meeting: On Recent Developments in Theoretical and Experimental General Relativity, Astrophysics and Relativistic Field Theories, ed. K. Rosquist, 1279 [CrossRef] [Google Scholar]
- Eskew, M., Zaritsky, D., & Meidt, S. 2012, AJ, 143, 139 [NASA ADS] [CrossRef] [Google Scholar]
- Gunn, J. E., & Gott, III., J. R. 1972, ApJ, 176, 1 [NASA ADS] [CrossRef] [Google Scholar]
- Kun, E., Keresztes, Z., Simkó, A., Szűcs, G., & Gergely, L. Á. 2017, A&A, 608, A42 [NASA ADS] [CrossRef] [EDP Sciences] [Google Scholar]
- Kun, E., Keresztes, Z., Das, S., & Gergely, L. Á. 2018, Symmetry, 10, 520 [CrossRef] [Google Scholar]
- Lelli, F., McGaugh, S. S., & Schombert, J. M. 2016, AJ, 152, 157 [Google Scholar]
- McGaugh, S. S., & Schombert, J. M. 2014, AJ, 148, 77 [NASA ADS] [CrossRef] [Google Scholar]
- Navarro, J. F., Frenk, C. S., & White, S. D. M. 1996, AJ, 462, 563 [Google Scholar]
- Planck Collaboration VIII. 2016, A&A, 594, A13 [NASA ADS] [CrossRef] [EDP Sciences] [Google Scholar]
- Planck Collaboration VI. 2018, A&A, submitted [arXiv:1807.06209] [Google Scholar]
- Rhee, G., Valenzuela, O., Klypin, A., Holtzman, J., & Moorthy, B. 2004, ApJ, 617, 1059 [NASA ADS] [CrossRef] [Google Scholar]
- Rodrigues, D. C., Marra, V., del Popolo, A., & Davari, Z. 2018, Nat. Astron., 2, 668 [NASA ADS] [CrossRef] [Google Scholar]
- Rubin, V. C., Thonnard, N., & Ford, Jr., W. K. 1978, ApJ, 225, L107 [NASA ADS] [CrossRef] [Google Scholar]
- Rubin, V. C., Burstein, D., Ford, Jr., W. K., & Thonnard, N. 1985, ApJ, 289, 81 [NASA ADS] [CrossRef] [Google Scholar]
- Swaters, R. A. 1999, PhD Thesis, Rijksuniversiteit Groningen [Google Scholar]
- Swaters, R. A., & Balcells, M. 2002, A&A, 390, 863 [NASA ADS] [CrossRef] [EDP Sciences] [Google Scholar]
- Swaters, R. A., Sancisi, R., van Albada, T. S., & van der Hulst, J. M. 2009, A&A, 493, 871 [NASA ADS] [CrossRef] [EDP Sciences] [Google Scholar]
- Tamm, A., & Tenjes, P. 2005, A&A, 433, 31 [NASA ADS] [CrossRef] [EDP Sciences] [Google Scholar]
- Tempel, E., & Tenjes, P. 2006, MNRAS, 371, 1269 [NASA ADS] [CrossRef] [Google Scholar]
- Verheijen, M. A. W. 2001, ApJ, 563, 694 [NASA ADS] [CrossRef] [Google Scholar]
- Wegg, C., Gerhard, O., & Portail, M. 2016, MNRAS, 463, 557 [NASA ADS] [CrossRef] [Google Scholar]
- Zhang, X., Chan, M. H., Harko, T., Liang, S.-D., & Leung, C. S. 2018, Eur. Phys. J. C, 78, 346 [NASA ADS] [CrossRef] [EDP Sciences] [Google Scholar]
- Zwicky, F. 1937, ApJ, 86, 217 [NASA ADS] [CrossRef] [Google Scholar]
All Tables
Best-fit parameters describing the luminosity density distribution of the baryonic matter of dwarf galaxies at 3.6 μm (indicated by the superscript NIR) and optical wavelengths (indicated by the superscript R).
Values of σ and τ for the 12 dwarf galaxies of the sample, which indicate how much larger the R-band M/L values of the bulge and disk are compared to those of the 3.6 μm M/L values.
Best-fit parameters of the rotational curve models of 12 dwarf galaxies, composed of baryonic matter and a nonrotating BEC component.
All Figures
|
Fig. 1. Exponential disk model (purple dashed line) from the SPARC database and Tempel–Tenjes disk model in the present paper, or bulge+disk model (black continuous line) of the 12 dwarf galaxies. The 3.6 μm SPARC surface brightness data are presented as black dots with error bars. The superscript star (⋆) indicates galaxies with a two-component stellar model (bulge+disk). |
| In the text | |
|
Fig. 2. Mass density models of the 12 galaxies at 3.6 μm (red line) and in R band (black line). The coordinate r is measured in the galactic plane (where a = r, because z = 0). The superscript star (⋆) indicates galaxies with a two-component stellar model (bulge+disk). |
| In the text | |
|
Fig. 3. Density of the srBEC halo (colored surface) as a function of the distance measured from the rotation axis of the galaxy in its equatorial plane (R, on the x-axis), and of the angular velocity (ω, on the y-axis). The ρ = 0 level surface is also indicated. The following model parameters are used: size of the BEC halo in the static limit, ℛ = 10 kpc, and the central density of ρc = 1 × 10⁻²⁴ g cm−3 (left panel), ρc = 2 × 10⁻²⁴ g cm−3 (middle), and ρc = 3 × 10⁻²⁴ g cm−3 (right). |
| In the text | |
|
Fig. 4. Density profile of the srBEC model (colored surface), as a function of the distance measured from the rotation axis of the galaxy in its equatorial plane (R, on the x-axis), and of the angular velocity (ω, on the y-axis). For comparison we also indicate the ρ = 0 level. The model parameters are as follows: the central density, ρc = 1 × 10⁻²⁴ g cm−3, and the size of the BEC halo in static limit is ℛ = 4 kpc (left panel) and ℛ = 16 kpc (right panel). |
| In the text | |
|
Fig. 5. Best-fit rotational curves of the dwarf galaxy sample. The dots with error-bars denote the observed rotational velocity curves. The fitted model, composed by a baryonic and a srBEC component is represented by the black curve. The red short-dashed curve draws the contribution of the stellar component, the blue tiny-dashed curve shows the contribution of the gas, and the long-dashed purple curve denotes the contribution of the srBEC-type DM halo to the rotation curve–models. |
| In the text | |
Current usage metrics show cumulative count of Article Views (full-text article views including HTML views, PDF and ePub downloads, according to the available data) and Abstracts Views on Vision4Press platform.
Data correspond to usage on the plateform after 2015. The current usage metrics is available 48-96 hours after online publication and is updated daily on week days.
Initial download of the metrics may take a while.