Fig. 7
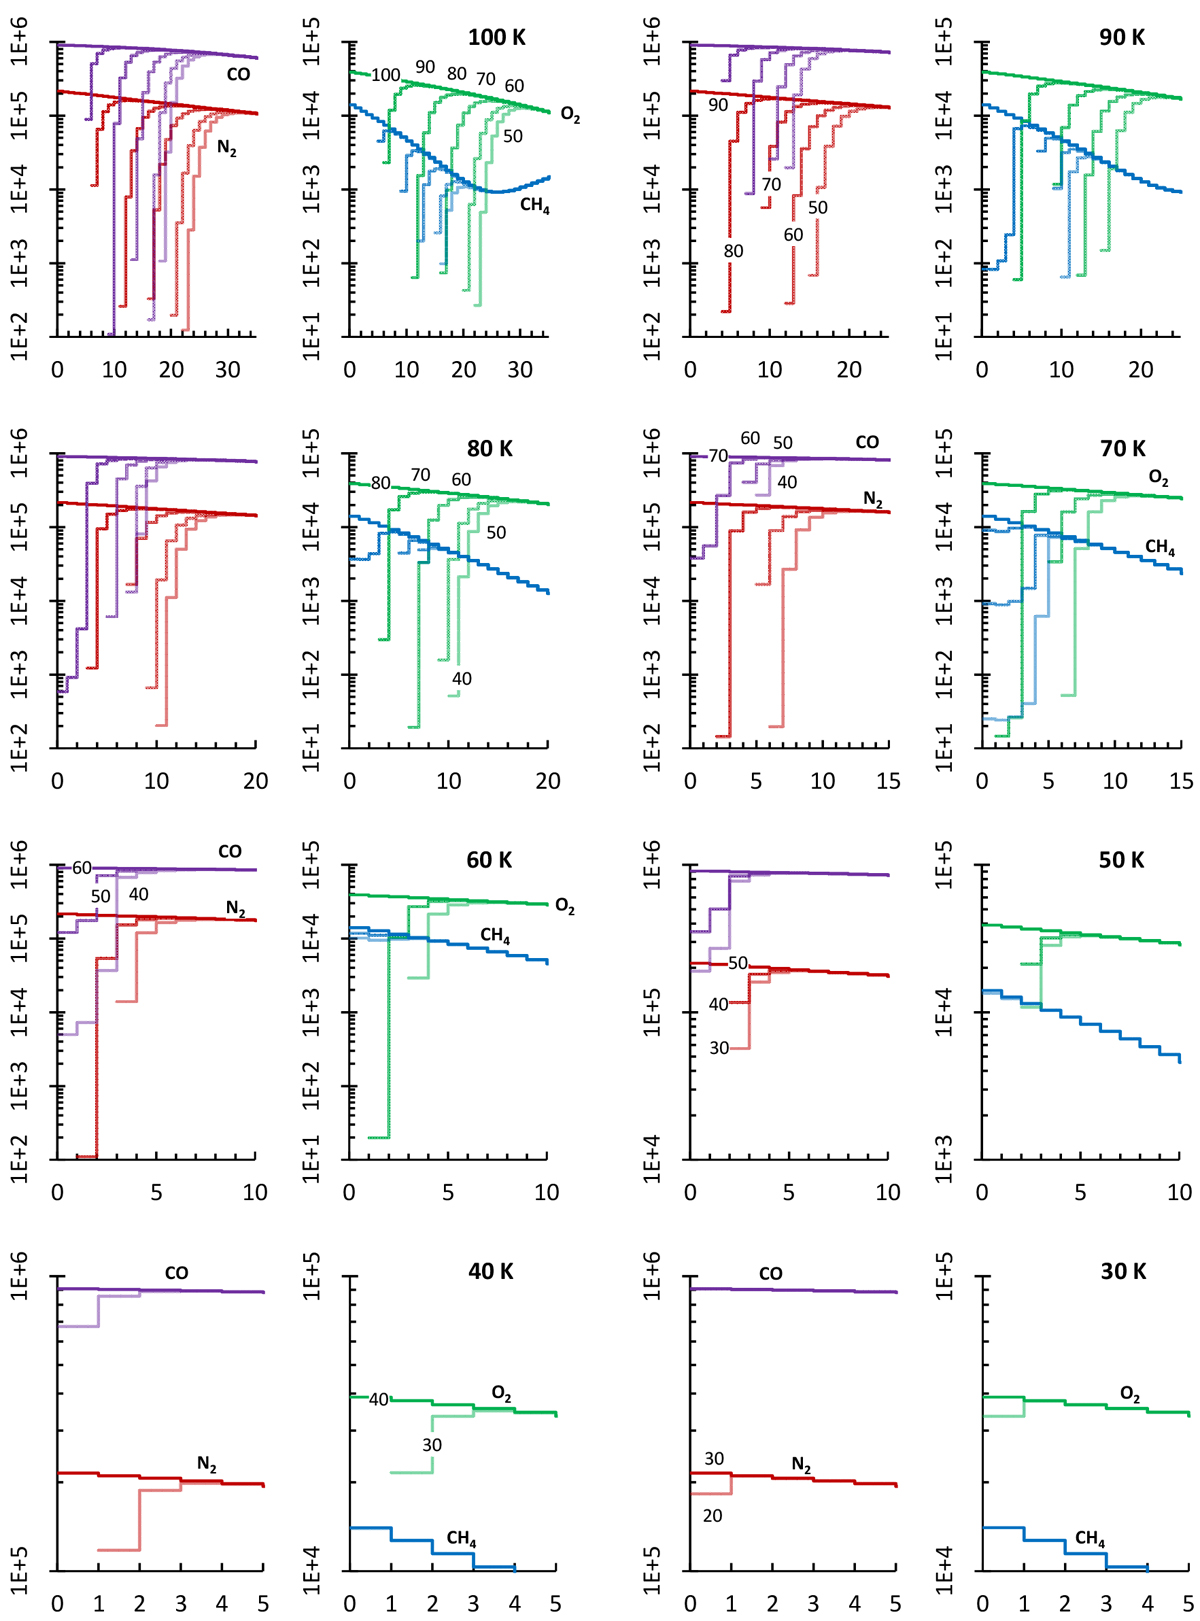
Composition of ice for simulations with different T0, given at several temperatures (multiples of 10 K) that occur during cooling. Low temperatures are not shown because the ice composition changes little after Tswitch. The results for each T0 are depicted in a pair of plots, with the respective temperatures indicated for only one of the species, but the temperature is also relevant for other species for the given T0. For clarity, the respective curves for each species are indicated only in every other plot. Water and carbon dioxide are not included because their numbers remain unchanged. The curve marked with the value of T0 is always the initial ice composition, fully depicted in Fig. 2.
Current usage metrics show cumulative count of Article Views (full-text article views including HTML views, PDF and ePub downloads, according to the available data) and Abstracts Views on Vision4Press platform.
Data correspond to usage on the plateform after 2015. The current usage metrics is available 48-96 hours after online publication and is updated daily on week days.
Initial download of the metrics may take a while.