Free Access
Fig. 6
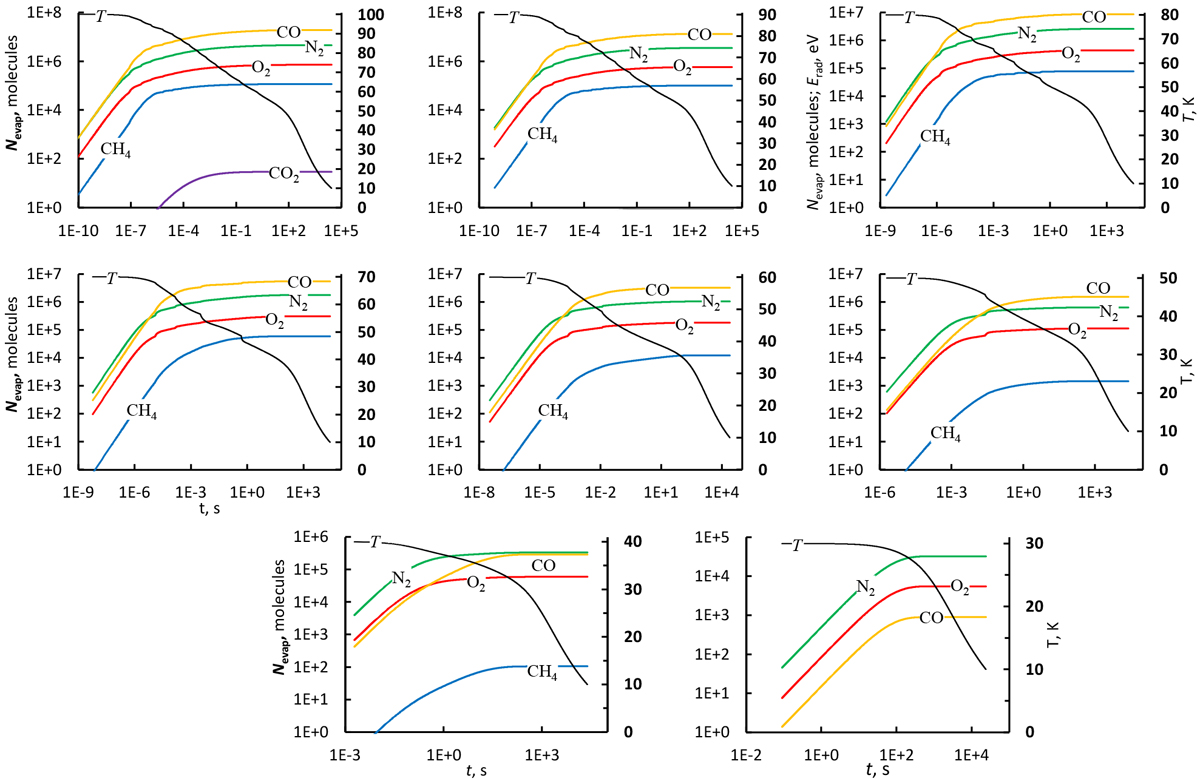
Evolution of the numbers of icy molecules that evaporated during cooling from different initial grain temperatures T0. The temperature curve is shown for context. T0 can be read as the maximum value of the secondary vertical axis on the right-hand side of each plot. The T0 = 20 K regime has no evaporated molecules.
Current usage metrics show cumulative count of Article Views (full-text article views including HTML views, PDF and ePub downloads, according to the available data) and Abstracts Views on Vision4Press platform.
Data correspond to usage on the plateform after 2015. The current usage metrics is available 48-96 hours after online publication and is updated daily on week days.
Initial download of the metrics may take a while.