Free Access
Fig. 3
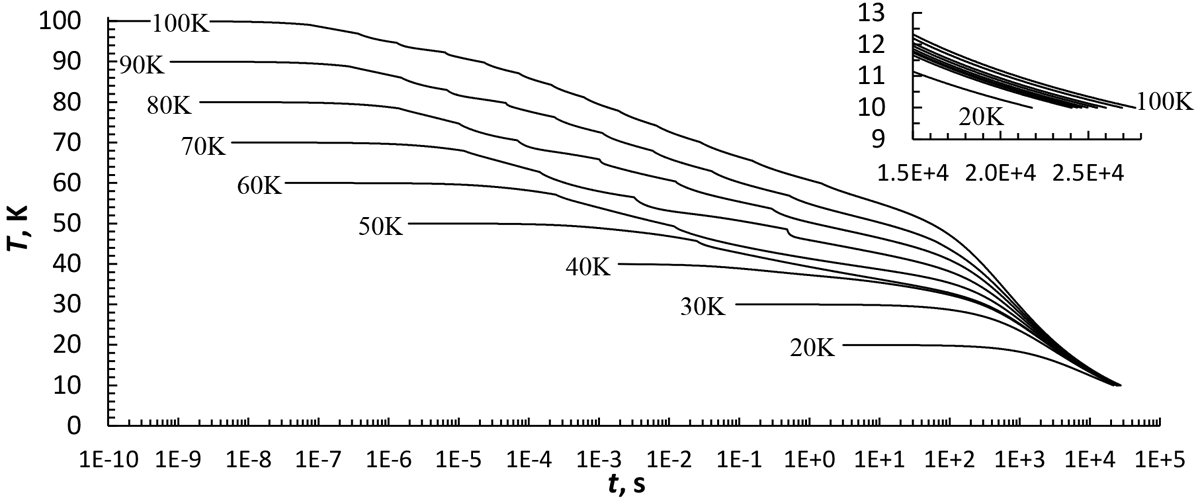
Calculated temperature for icy grains with different initial temperatures T0 (K). The inset shows the last few degrees of cooling (before the stop at 10 K), which takes most of the entire cooling time.
Current usage metrics show cumulative count of Article Views (full-text article views including HTML views, PDF and ePub downloads, according to the available data) and Abstracts Views on Vision4Press platform.
Data correspond to usage on the plateform after 2015. The current usage metrics is available 48-96 hours after online publication and is updated daily on week days.
Initial download of the metrics may take a while.