Fig. 1
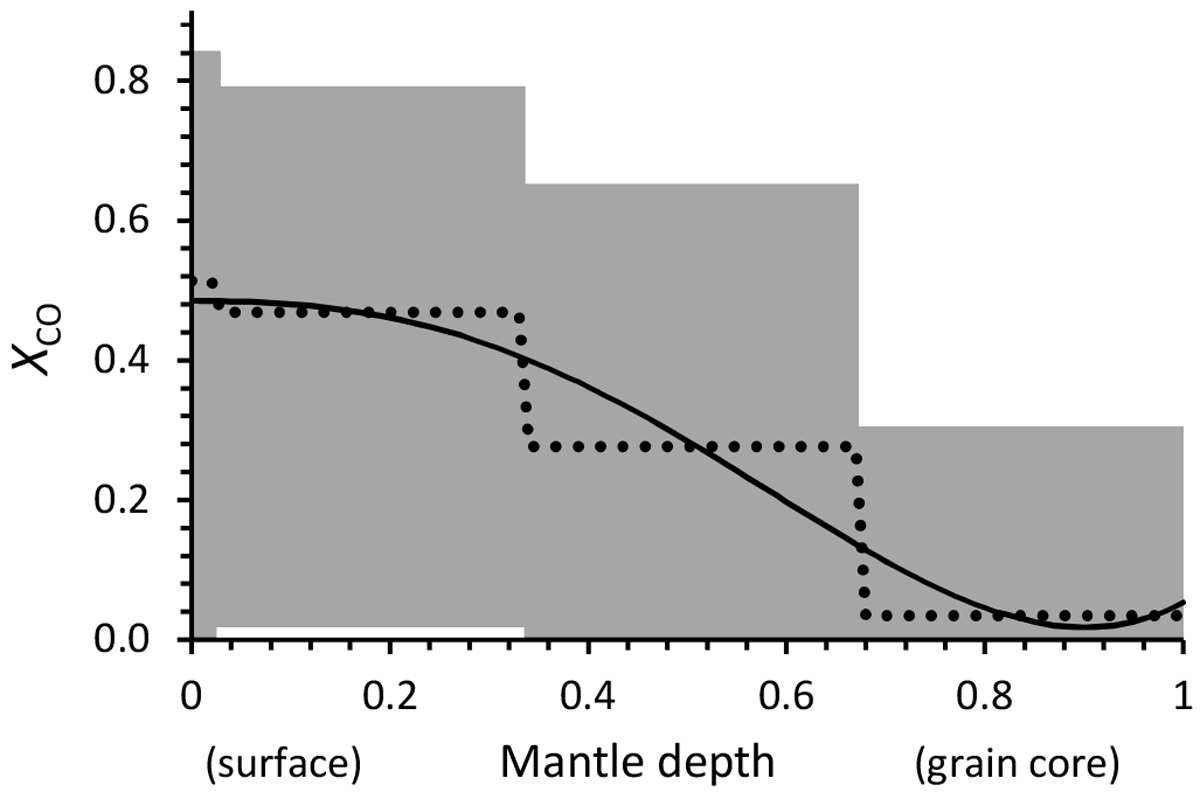
Example of source data for the CO molecule for obtaining ice molecule abundances as a function of ice depth. The y-axis indicates thepart of an ice layer that consists of CO, while the x-axis gives the mantle depth from the surface in decimal parts (in Fig. 2 it is multiplied by 100, the number of MLs). The dotted line is the average relative abundance of CO in ice, and the shaded area represents the interval of possible values, while the solid line is the CO abundance function used in the model, Eq. (20); this is a trend line of the average values.
Current usage metrics show cumulative count of Article Views (full-text article views including HTML views, PDF and ePub downloads, according to the available data) and Abstracts Views on Vision4Press platform.
Data correspond to usage on the plateform after 2015. The current usage metrics is available 48-96 hours after online publication and is updated daily on week days.
Initial download of the metrics may take a while.