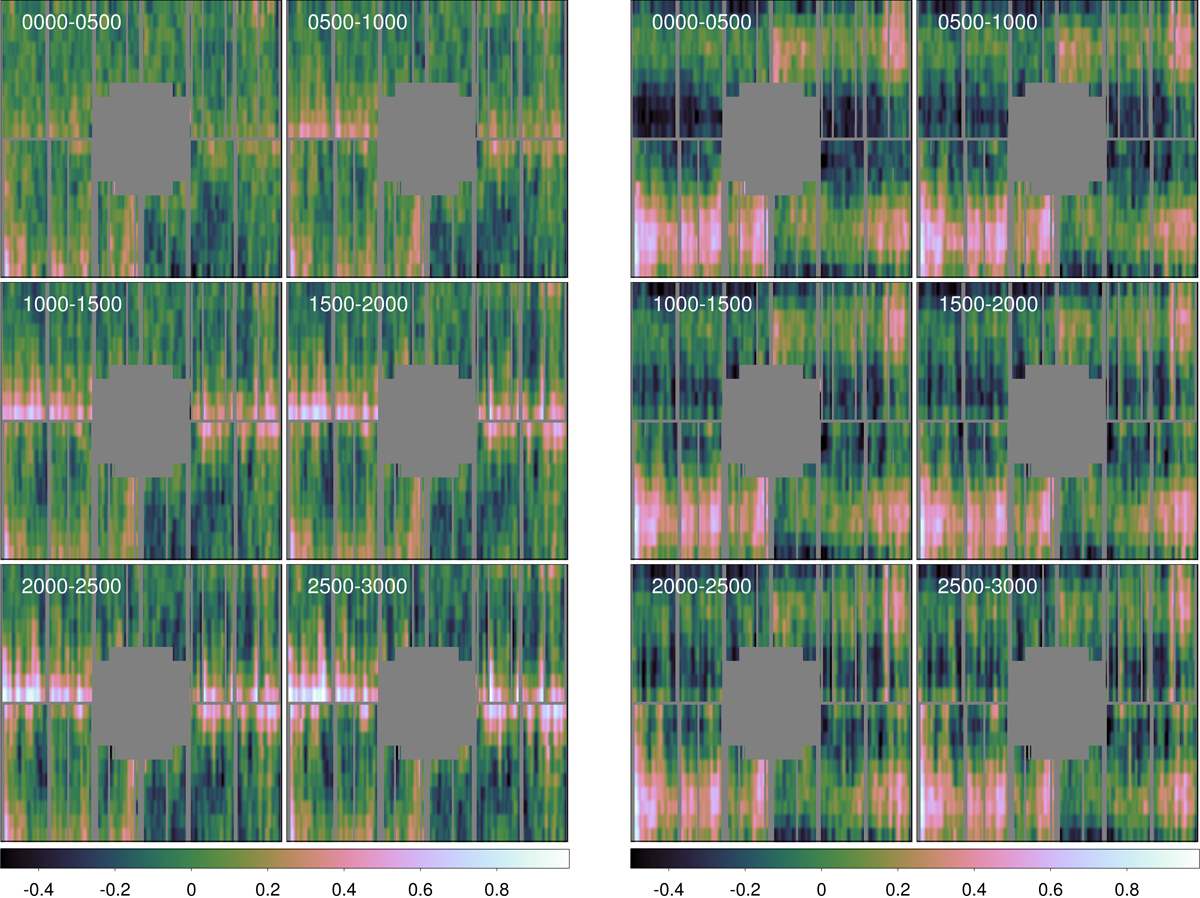
Fig. 6.

Redshift of the Cu-Kα line (in per cent) as a function of detector position over the mission lifetime in FF (left) and EFF (right) modes, after correcting for the average value. The range shown in the top-left of each panel is the XMM revolution. The shift has been measured in 1 × 20 pixel regions and a σ = 2 pixel Gaussian smoothing applied for display. Detector regions with a large uncertainty in a combined error map have been masked out.
Current usage metrics show cumulative count of Article Views (full-text article views including HTML views, PDF and ePub downloads, according to the available data) and Abstracts Views on Vision4Press platform.
Data correspond to usage on the plateform after 2015. The current usage metrics is available 48-96 hours after online publication and is updated daily on week days.
Initial download of the metrics may take a while.


