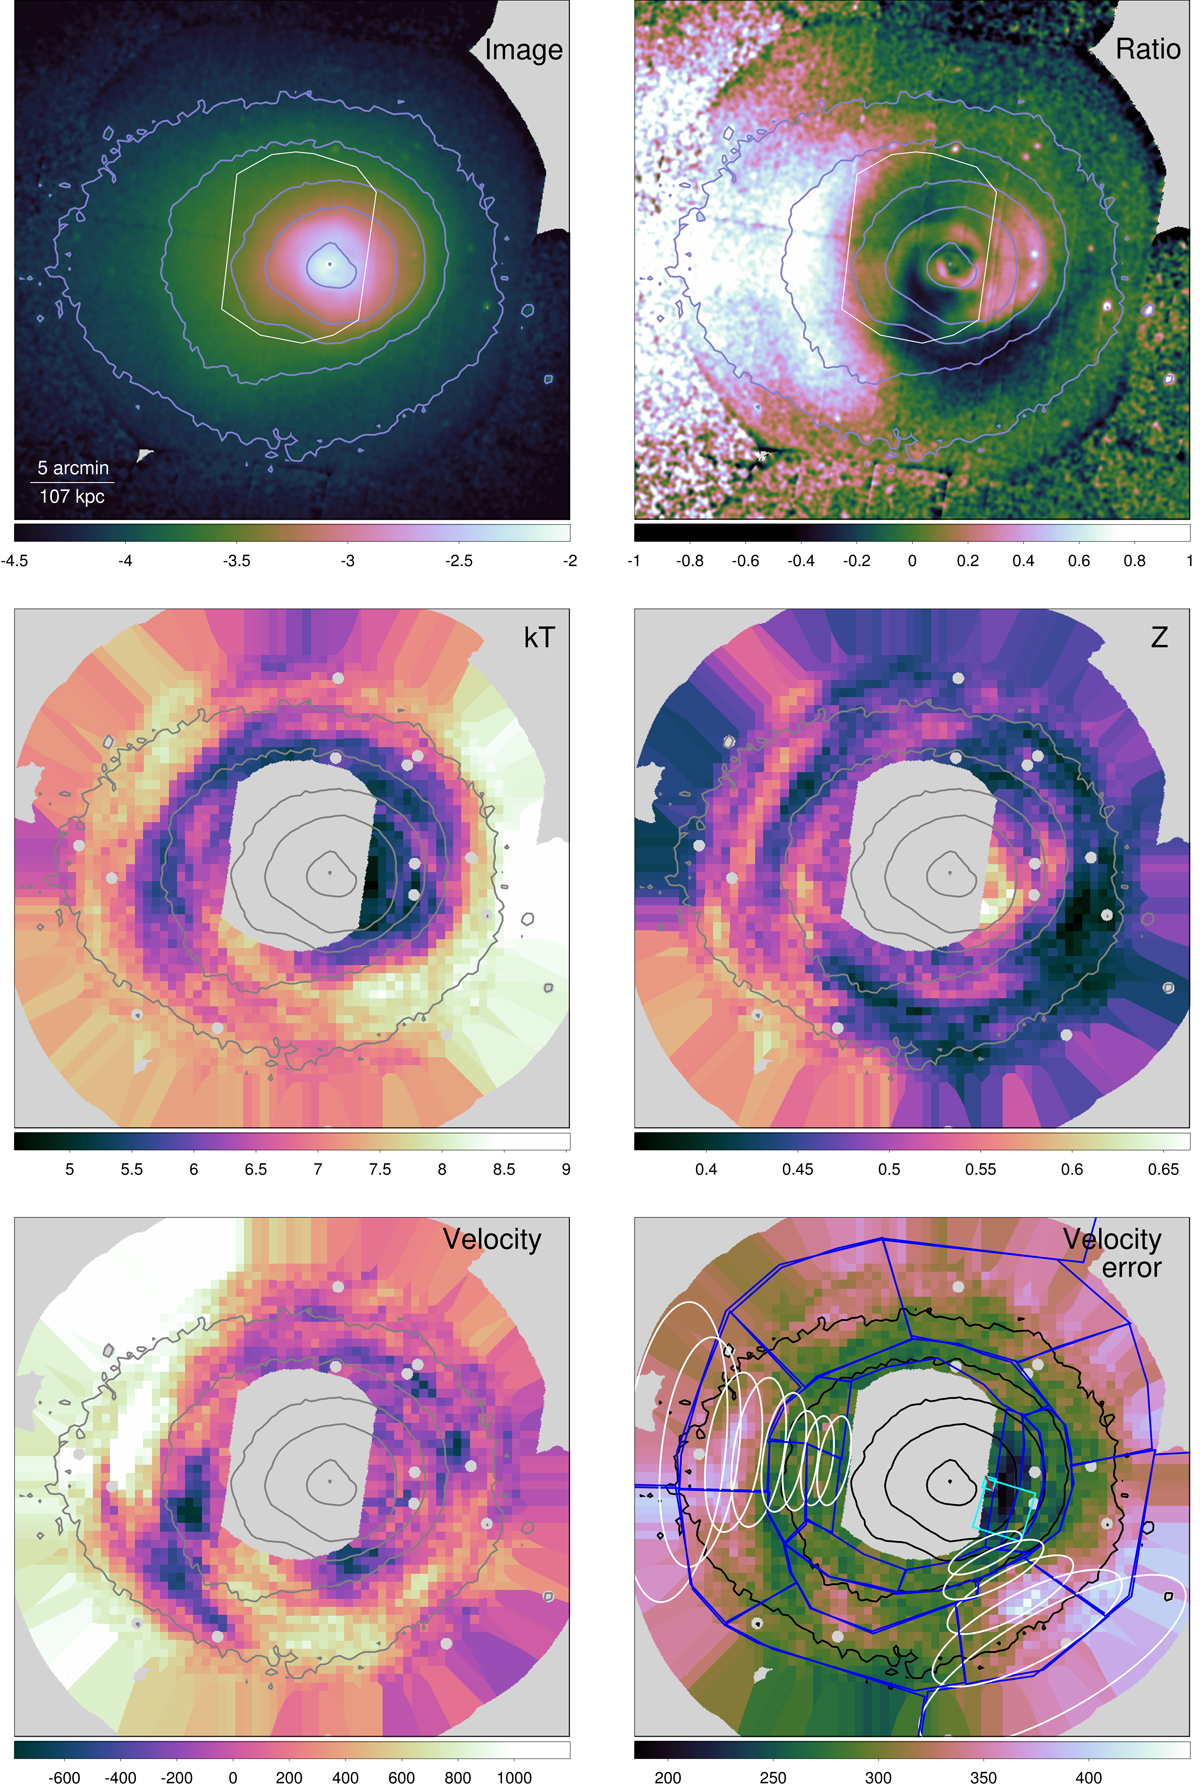
Fig. 16.

Perseus cluster maps. Shown is the 0.5 to 2 keV X-ray surface brightness and contours (log cts s−1 per 1.6 arcsec pixel; top left), fractional difference of surface brightness to radial average (top right), temperature (keV; centre left), metallicity (Z⊙; centre right), velocity relative to the cluster value in H16 (km s−1; bottom left) and 1σ statistical uncertainty on velocity (km s−1; bottom right). Maps were created by a moving 3:1 elliptical region (rotated to lie tangentially to the nucleus) containing ∼700 Fe-K counts (see example ellipses in velocity error plot). The pixels are not statistically independent.
Current usage metrics show cumulative count of Article Views (full-text article views including HTML views, PDF and ePub downloads, according to the available data) and Abstracts Views on Vision4Press platform.
Data correspond to usage on the plateform after 2015. The current usage metrics is available 48-96 hours after online publication and is updated daily on week days.
Initial download of the metrics may take a while.


