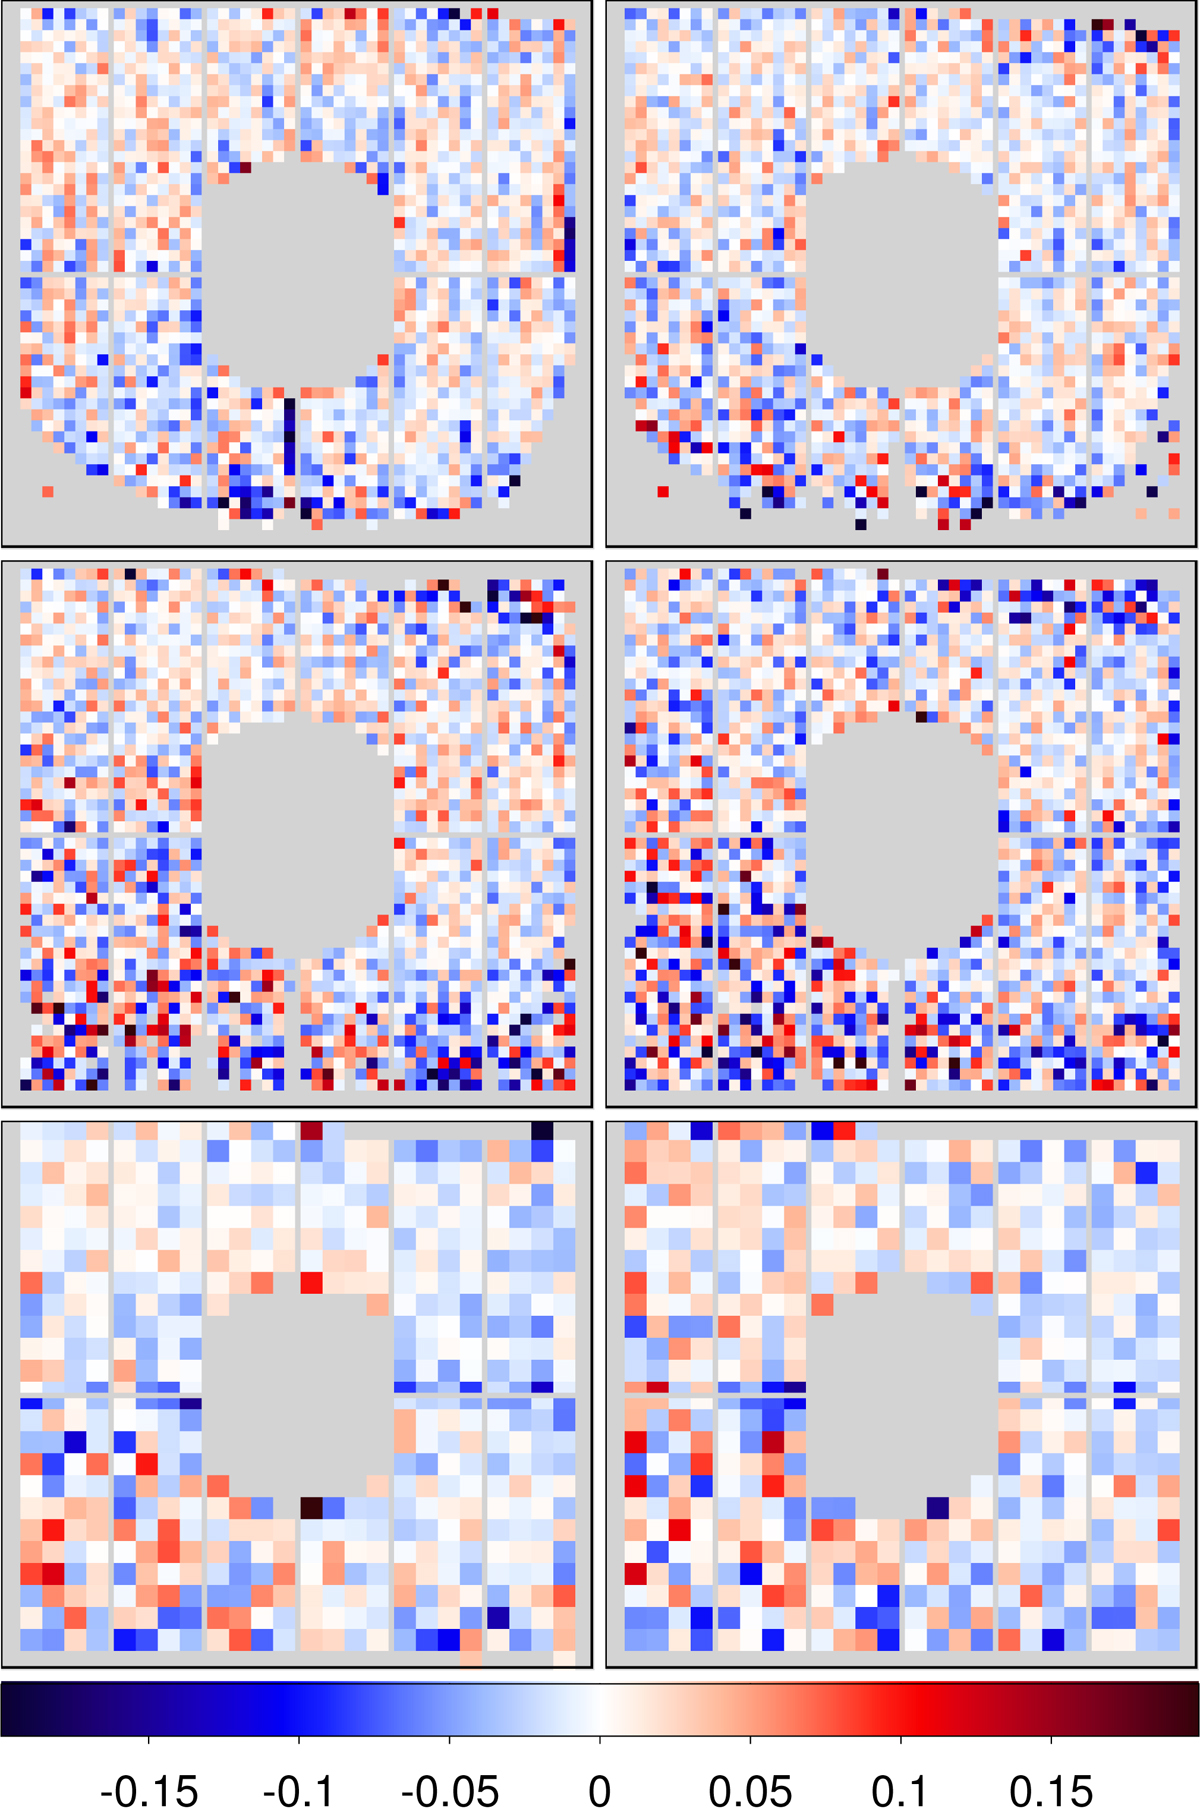
Fig. 10.

Maps of the residual energy correction factor in stacked observations, after applying our correction to this in the individual observations. The units are per cent per keV. The panels show revolution bins of 0–500, 500–1000, 1000–1500, 1500–2000, 2000–2500 and 2500–3000 (left to right and top to bottom). The uncertainty of these values is not the same across the detector or in time, so we use 8 and 16 pixel binning. The statistical uncertainty is much larger in the bottom-left area because of the non-uniformity of the calibration source. Pixels where the uncertainty is larger than 10−3 keV−1 are not shown.
Current usage metrics show cumulative count of Article Views (full-text article views including HTML views, PDF and ePub downloads, according to the available data) and Abstracts Views on Vision4Press platform.
Data correspond to usage on the plateform after 2015. The current usage metrics is available 48-96 hours after online publication and is updated daily on week days.
Initial download of the metrics may take a while.


