Fig. 9.
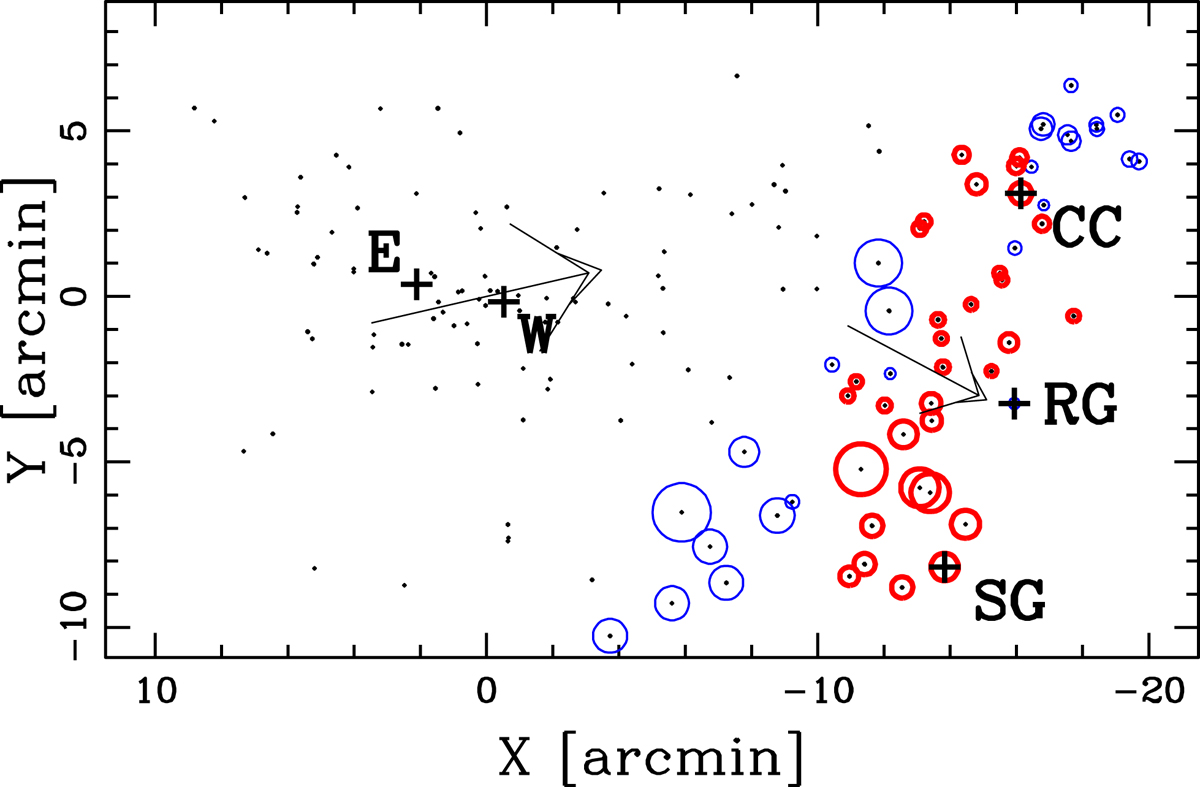
Bubble plot for 58 red galaxies belonging to west region (CIZAJ1824 + southwestPeak) where velocity gradient, pointing from low to high velocities, is indicated by small arrow. The spatial distribution of all red galaxies is indicated by small black dots and the related velocity gradient is indicated by the big arrow, pointing from RXCJ1825 to CIZAJ1924.
Current usage metrics show cumulative count of Article Views (full-text article views including HTML views, PDF and ePub downloads, according to the available data) and Abstracts Views on Vision4Press platform.
Data correspond to usage on the plateform after 2015. The current usage metrics is available 48-96 hours after online publication and is updated daily on week days.
Initial download of the metrics may take a while.