Fig. 7.
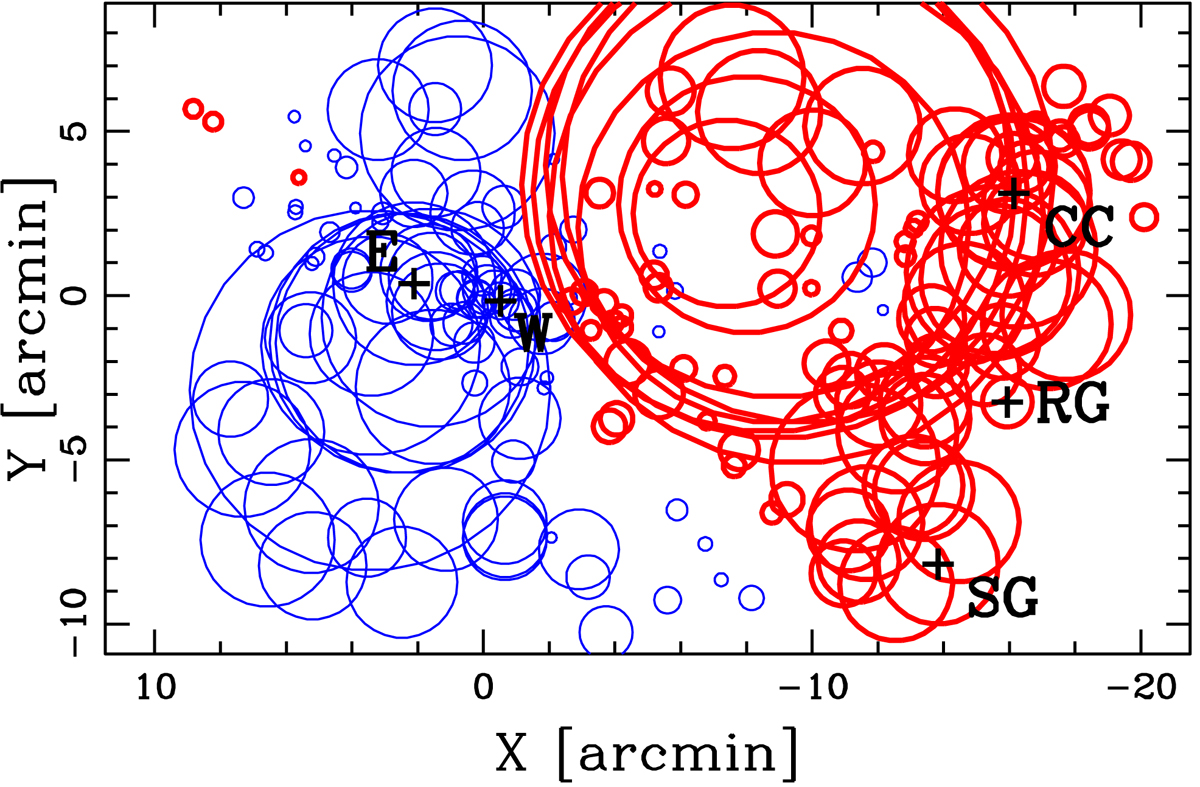
Spatial distribution of 198 members of Lyra complex, each marked with circle. The larger the circle, the larger the deviation δV, i is (the so-called bubble plot). Thin blue and thick red circles show where the value of the local mean velocity is smaller or larger than the global value. The plot is centered on the X-ray centroid of RXCJ1825 and prominent galaxies are indicated for an easier comparison with Fig. 4.
Current usage metrics show cumulative count of Article Views (full-text article views including HTML views, PDF and ePub downloads, according to the available data) and Abstracts Views on Vision4Press platform.
Data correspond to usage on the plateform after 2015. The current usage metrics is available 48-96 hours after online publication and is updated daily on week days.
Initial download of the metrics may take a while.