Fig. 4.
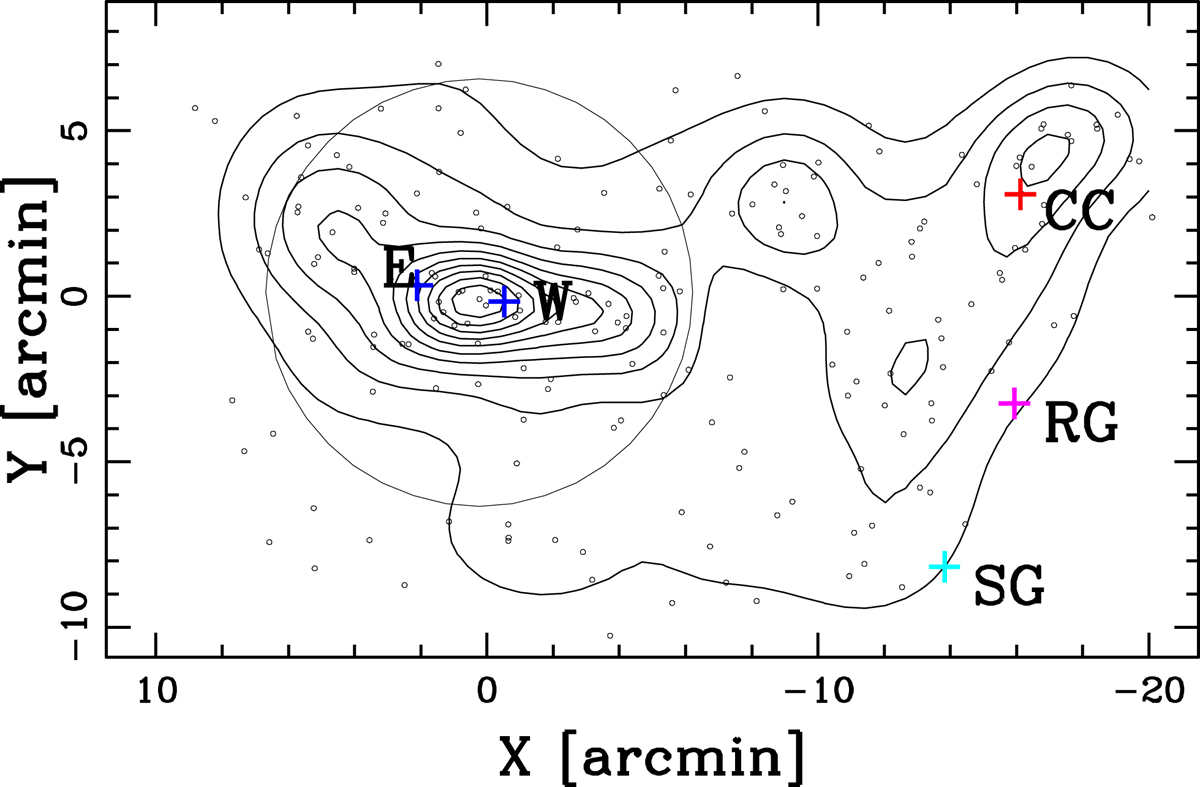
Spatial distribution on sky and relative isodensity contour map of 198 spectroscopic members of Lyra complex obtained with 2D-DEDICA method. The peaks from east to west are RXCJ1825NE, RXCJ1825main, MiddlePeak, and CIZAJ1824 (see Table 2). The plot is centered on the X-ray centroid of RXCJ1825. The position of the prominent galaxies (BCGs of RXCJ1825, BCG of CIZAJ1824, SG, and RG) are indicated by crosses (blue, red, cyan, and magenta, respectively). The region of RXCJ1825 within 0.5 Mpc is enclosed by the circle for easier comprehension of the projected Mpc size.
Current usage metrics show cumulative count of Article Views (full-text article views including HTML views, PDF and ePub downloads, according to the available data) and Abstracts Views on Vision4Press platform.
Data correspond to usage on the plateform after 2015. The current usage metrics is available 48-96 hours after online publication and is updated daily on week days.
Initial download of the metrics may take a while.