Fig. 13.
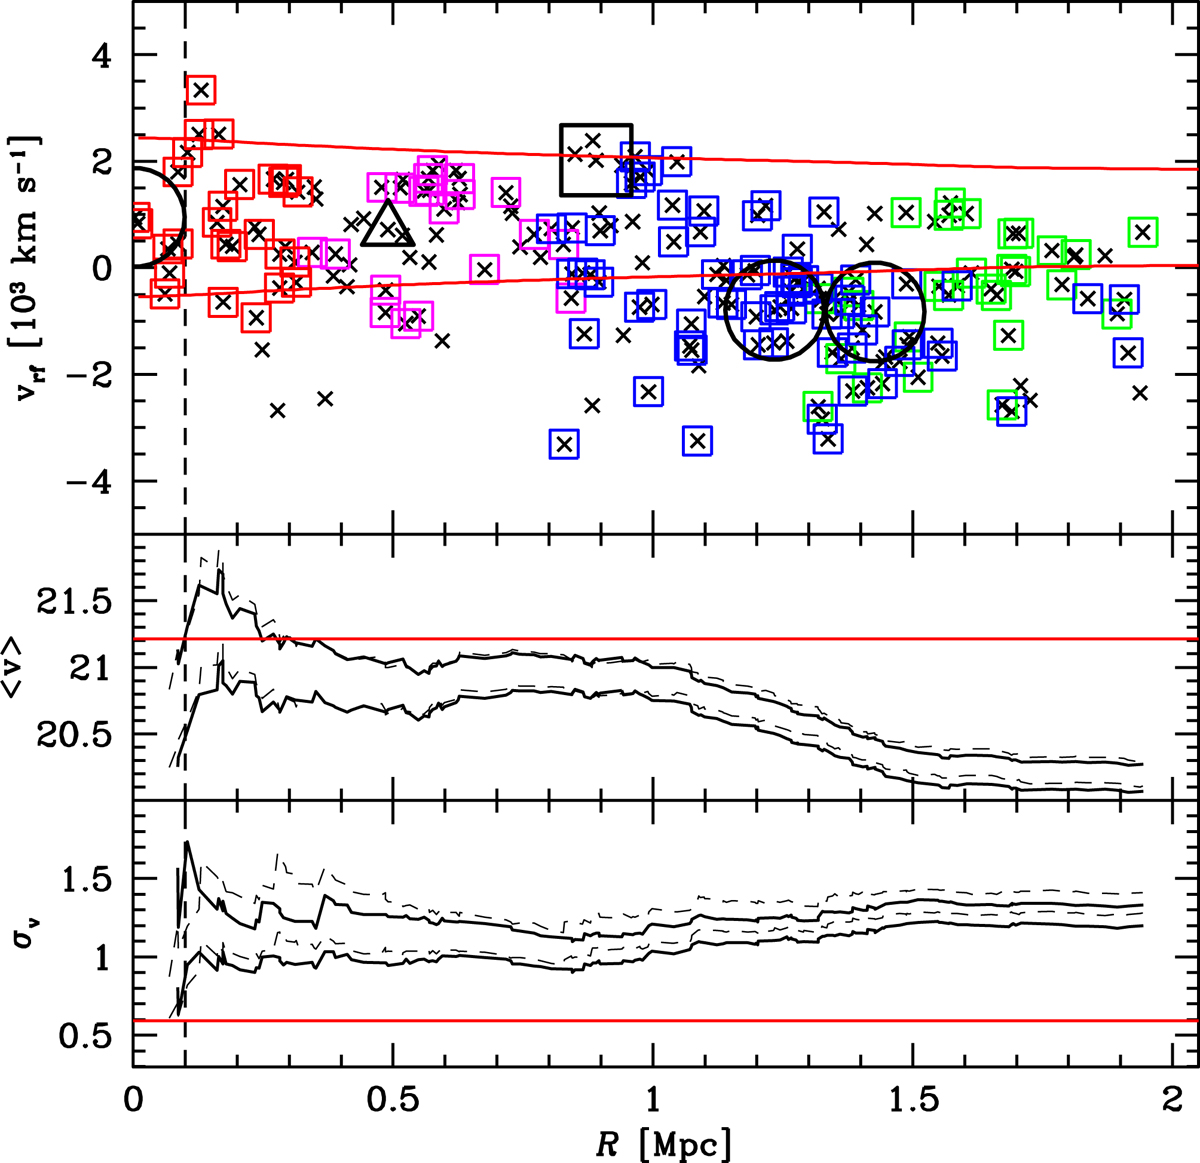
Same as Fig. 12, but centered on BCG-CC, adopted center of CIZAJ1824. Dashed red curves in the top panel show the limits due to the escape velocity in CIZAJ1824. Middle panel: the red horizontal line indicates the velocity of BCG-CC. Bottom panel: the red horizontal line indicates the value of the X-ray temperature of CIZAJ1824 estimated by Clavico et al. (2019). In the three panels the vertical dashed line contains the very central region of CIZAJ1824 discussed in the text.
Current usage metrics show cumulative count of Article Views (full-text article views including HTML views, PDF and ePub downloads, according to the available data) and Abstracts Views on Vision4Press platform.
Data correspond to usage on the plateform after 2015. The current usage metrics is available 48-96 hours after online publication and is updated daily on week days.
Initial download of the metrics may take a while.