Fig. 12.
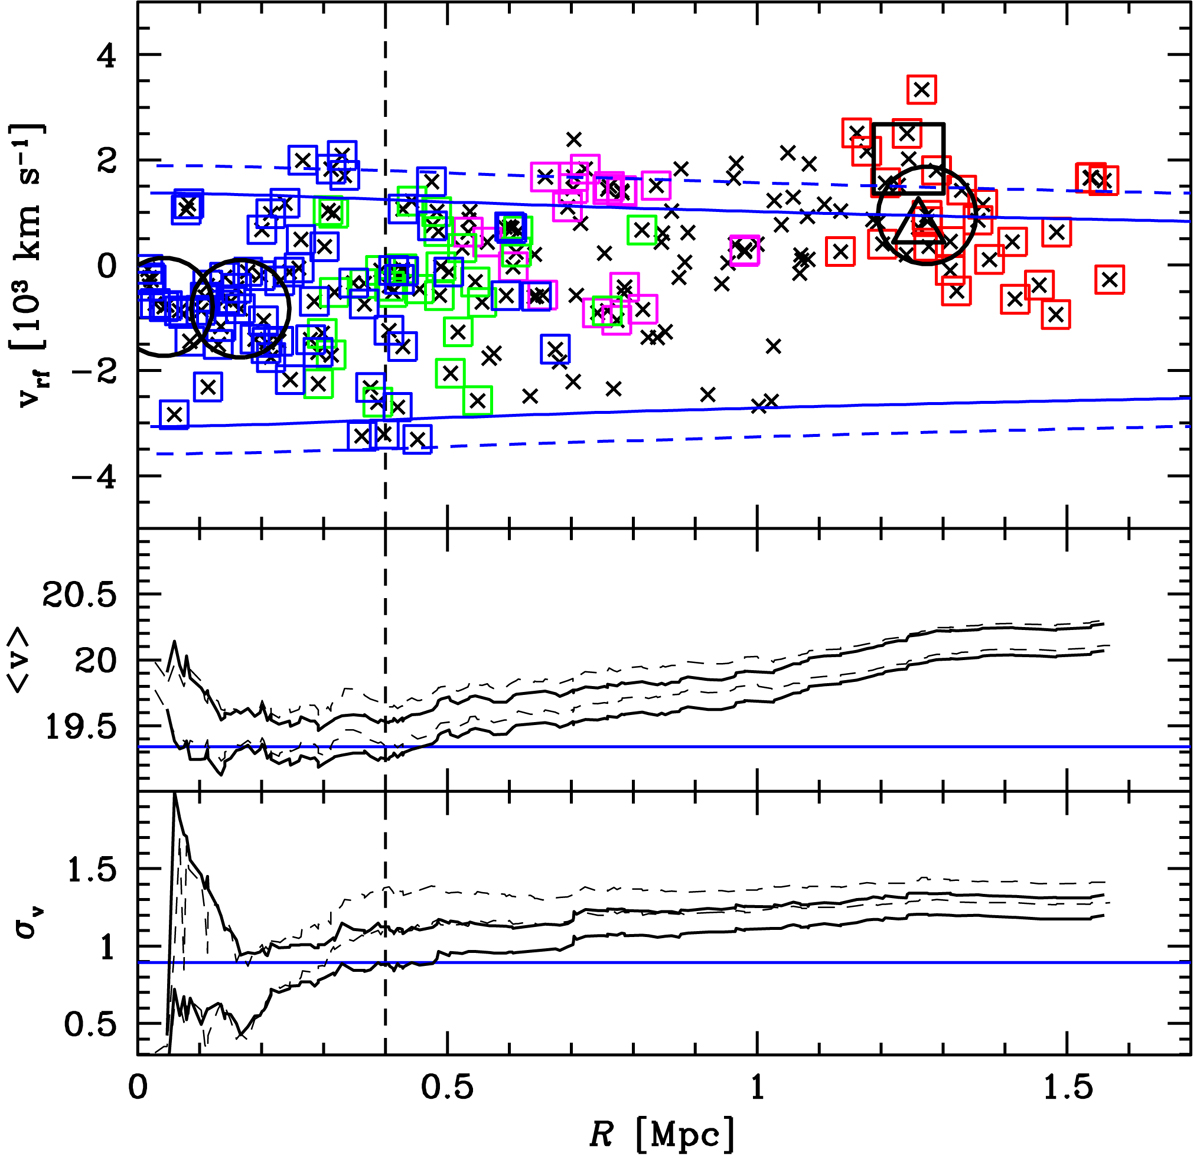
Top panel: system rest–frame velocity versus projected clustercentric distance for 198 galaxies in whole cluster complex. The center is the position of the X-ray centroid of RXCJ1825. Blue, green, magenta, and red squares indicate galaxies belonging to the four peaks detected by the 2D-DEDICA method, that is RXCJ1825main, RXCJ1825NE, MiddlePeak, and CIZAJ1824 (see Fig. 4 and Table 2). The two close large circles indicate the two BCGs of RXCJ1825. The other large circle indicates BCG-CC of the CIZAJ1824 cluster. The large square indicates the SG galaxy and the triangle indicates the RG radio-galaxy. Solid and dashed blue curves show the limits due to the escape velocity in RXCJ1825, based on red and all galaxies, respectively (see Sect. 6). Middle and bottom panels: integral profiles of mean velocity and velocity dispersion (only one-σ error bands are shown) which, by definition, converge toward global values of whole complex. Solid and dashed lines refer to red and all galaxy populations. The vertical axes are in units of 103 km s−1. Middle panel: the blue horizontal line indicates the mean velocity of the two BCGs of RXCJ1825. Bottom panel: the blue horizontal line indicates the value of the X-ray temperature of RXCJ1825 estimated by Clavico et al. (2019) and here transformed in σV, assuming βspec = 1 (see Sect. 8). In the three panels the vertical dashed line contains the central region of RXCJ1825 suggested to be uncontaminated by galaxies of the companion cluster or other substructures (see text).
Current usage metrics show cumulative count of Article Views (full-text article views including HTML views, PDF and ePub downloads, according to the available data) and Abstracts Views on Vision4Press platform.
Data correspond to usage on the plateform after 2015. The current usage metrics is available 48-96 hours after online publication and is updated daily on week days.
Initial download of the metrics may take a while.