Fig. 10.
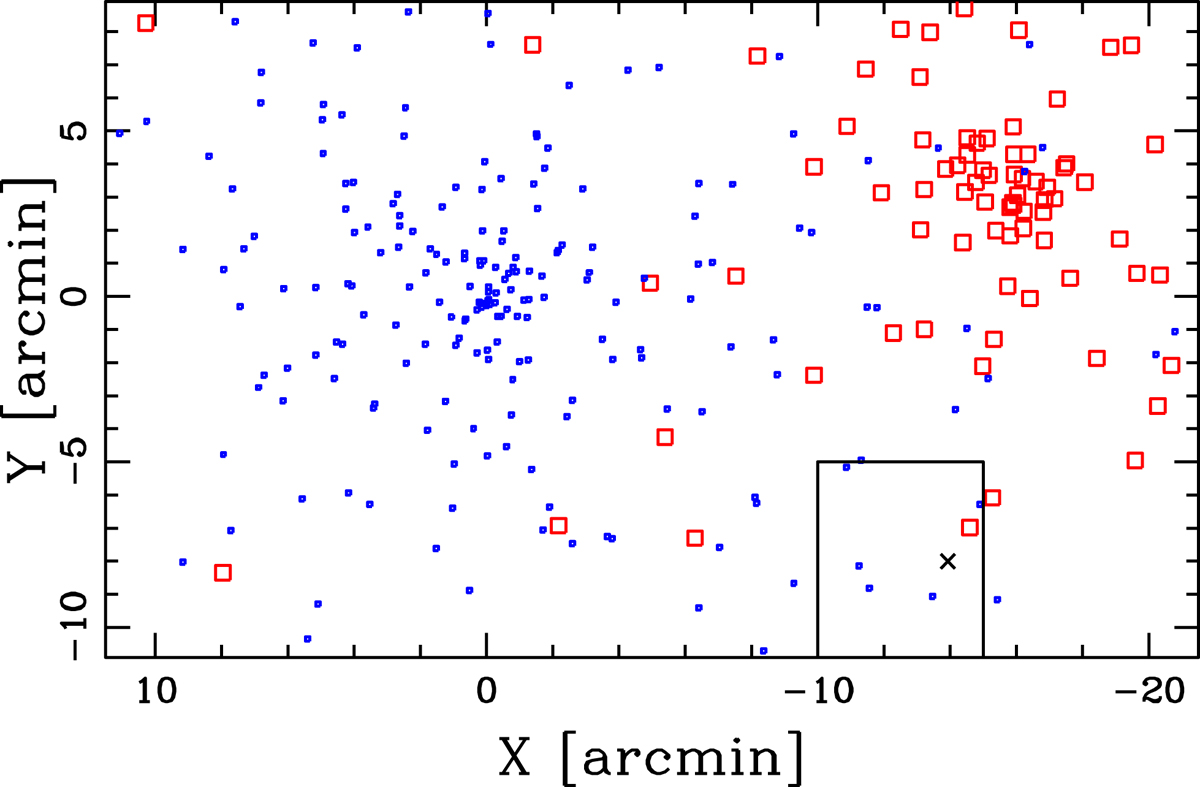
Spatial distribution of simulated galaxies of RXCJ1825+CIZAJ1824 system. Blue and red points indicate galaxy points of RXCJ1825 and CIZAJ1824, at low and high velocities, respectively. The black cross indicates the position of SG and the rectangle delimits a region close to SG where the real velocity field is characterized by high velocities (cf. Figs. 7 and 8, lower panel).
Current usage metrics show cumulative count of Article Views (full-text article views including HTML views, PDF and ePub downloads, according to the available data) and Abstracts Views on Vision4Press platform.
Data correspond to usage on the plateform after 2015. The current usage metrics is available 48-96 hours after online publication and is updated daily on week days.
Initial download of the metrics may take a while.